I would like to share one of the simple methods but very effective and efficient method to calculate target during breakouts.
**
The simple thing to do after properly drawing patterns is to make note of low and high and the difference of low and high is calculated for target calculation. if the breakout is on the upside then value difference is added from the breakout point. if it is a breakdown then value difference is subtracted from the breakdown to calculate target.
**
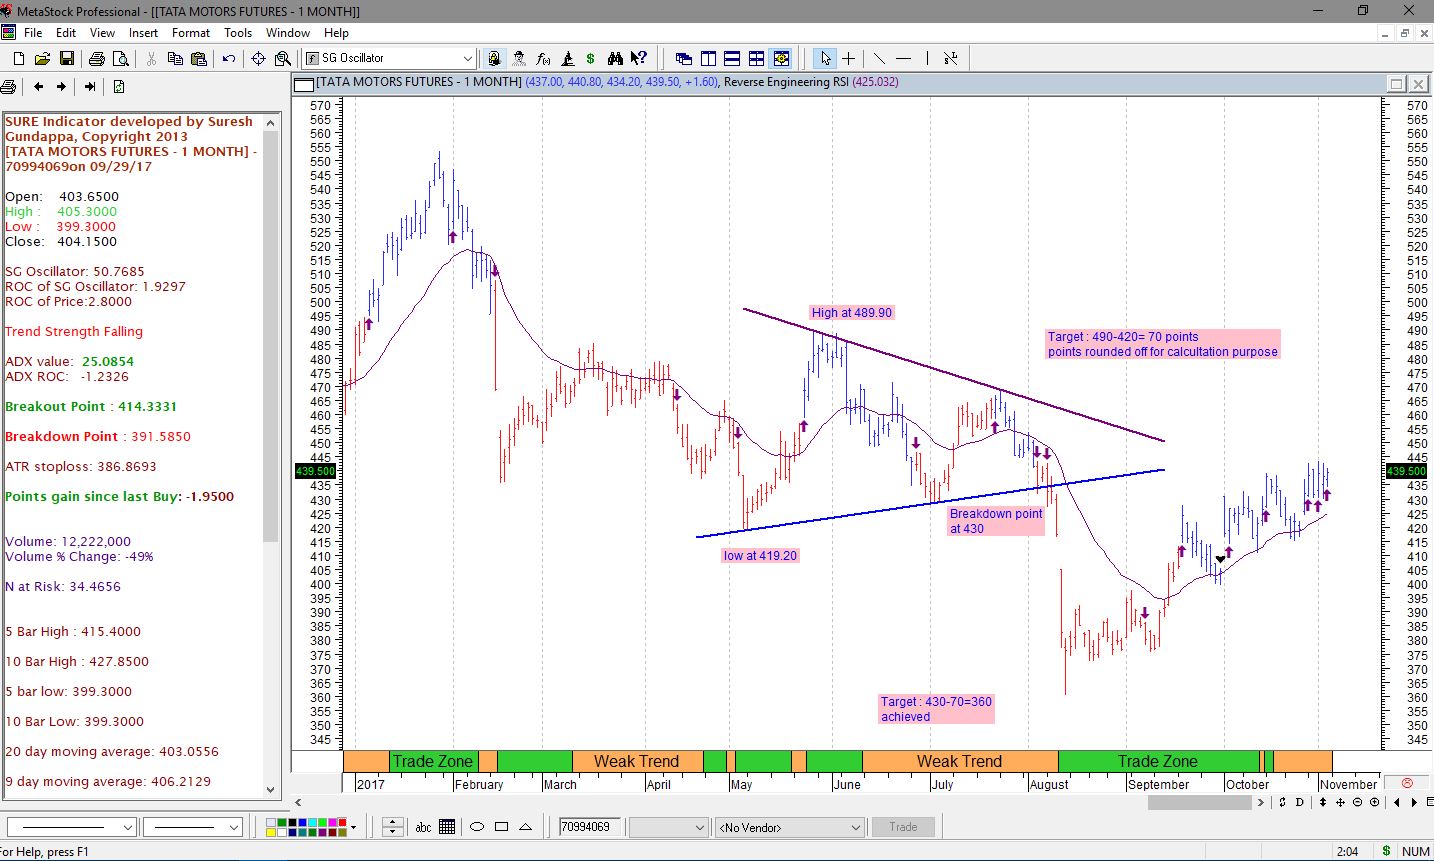
I am illustrating the same with a tatamotors chart which you may find it useful. As a matter of note please ignore the indicators on the chart as they are less relevant when you trade classical chart patterns.
Please note that in tatamotors chart I have shown breakdown from a wedge pattern. points to be noted are
1, any trend line to be valid should have minimum two touch points.
2. within the wedge pattern TM made a low of 420 and high of 490 ( I have rounded off figures)
3. TM brokedown from 430 area and the difference of high and low with a wedge pattern was 70 points (490-420).
4. target from breakdown point is 430-70 =360… if you notice that is where it took support.
for breakout do the vice versa of adding difference value to targets
- Please note that most of the time stocks tend to move up even after hitting target and then you have to manage trailing stop-loss, I tend to book profits at the target and leave little on table.
- The good thing about breakout is that you can keep stoploss extremely low that low of bar of the breakout.
- As always in stock markets nothing is fool proof and this also fails often with respect to target as well as breakouts, trade with caution and stoploss
I wish you best
Suresh


7 Likes
Thanks Suresh. Very useful.
1 Like
@SureshG. Nice.
Most of the time traders wont be able to enter just before or just after the trend line break. Because the markets are just too fast. This happens especially when the break out happens with heavy volume.
Do you know from experience, any method to enter when the markets are still thinking about breaking out. This question may look stupid but answer if any will be very useful for traders.
1 Like
Put a limit order slightly above the breakout for going long , & a limit order below the breakout for going short & if breakout happens then your order would get execute. But tell you one thing from my experience, many times stocks give false breakouts too & after giving breakout , the price starts moving in opposite direction!!
Nothing is foolproof in stocks market.
1 Like
@Spaceship only if we can place a conditional order. Else a buy limit order above the breakout price will get executed in any case even before breakout.
1 Like
@TraderVenk… usually if you are a pattern trader then you just enter as soon as the price closed below trend line. Another way of knowing whether this breakout continues or not is to go to one level time frame below to check the momentum.
Let me share a simple strategy to check for the probability of breakout( remember nothing is fool proof in this market). When I am checking breakout pattern on daily charts, I will go to one hour chart and check if any of the regular indicators like MACD , moving average crossover are giving breakout or breakdown. for the first few initial days until the breakdown or breakout is established, I watch one hour closely for reversals. once breakdown happens or stocks move by 3-5% in my direction then I switch back to day chart and monitor my stop-loss and targets.
Does this makes sense?
1 Like
Good idea to go for smaller time frame.
But do u think 1 hour chart cud be too late to get out. Will a 10 mts or 15 mts chart help. Or will that be too much of noise.
yes…15 minutes will see many whipsaws and you cannot locate momentum direction properly. idea is to just have little edge over daily chart but not entirely different chart. In-fact lot them try 3 hour chart to catch momentum for daily chart trades
1 Like