1) when & why do the bars on top / bottom of the zero line ?
2) histogram always has a positive or negative value ..... what do they indicate ?
3) is this indicator sufficient alone or should be clubbed with any other tool as well ?
thank you
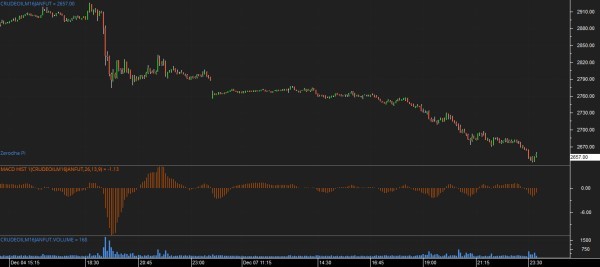
1) when & why do the bars on top / bottom of the zero line ?
2) histogram always has a positive or negative value ..... what do they indicate ?
3) is this indicator sufficient alone or should be clubbed with any other tool as well ?
thank you
Please refer the below link for better understanding of MACD histogram with example.
http://stockcharts.com/school/doku.php?id=chart_school:technical_indicators:macd-histogram