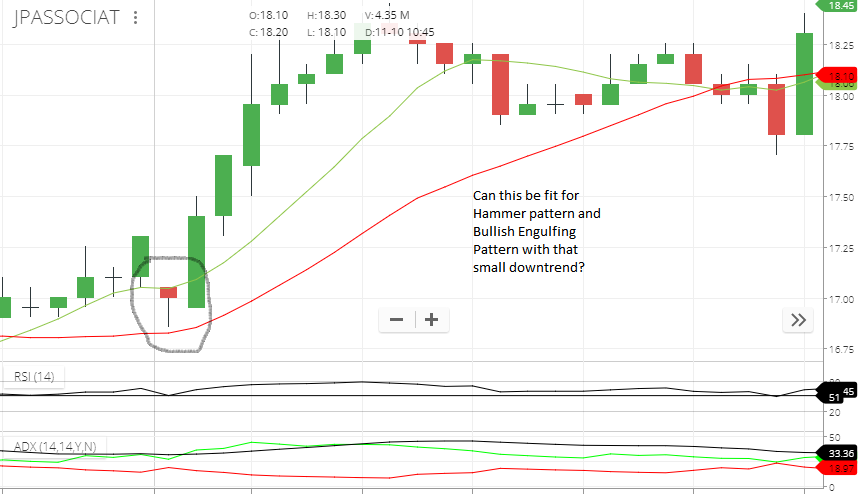
Quoting from Varsity:
The Hammer formation
“The bullish hammer is a significant candlestick pattern that occurs at the bottom of the trend. A hammer consists of a small real body at the upper end of the trading range with a long lower shadow. The longer the lower shadow the more bullish the pattern.”
The chart below shows the presence of two hammers formed at the bottom of a downtrend.
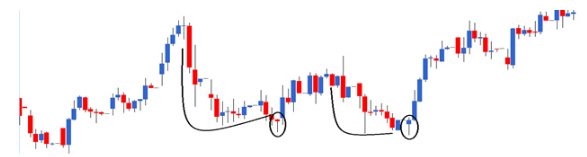
More here.
The Bullish Engulfing Pattern
"The bullish engulfing pattern is a two-candlestick pattern which appears at the bottom of the downtrend. As the name suggests, this is a bullish pattern which prompts the trader to go long. The two-day bullish engulfing pattern is encircled in the chart below. The prerequisites for the pattern are as follows:
- The prior trend should be a downtrend
- The first day of the pattern (P1) should be a red candle reconfirming the bearishness in the market
- The candle on the 2nd day of pattern (P2) should be a blue candle, long enough to engulf the red candle"
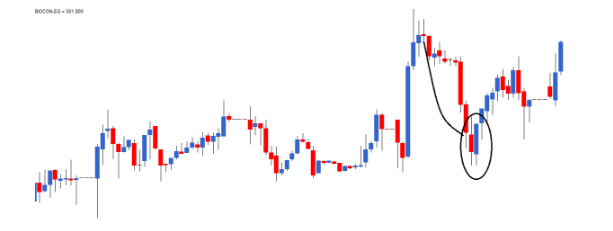
Read more here