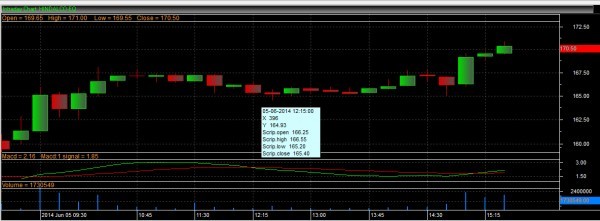
Its quite difficult to read the values from the chart you've posted. So I'll ignore the chart and try and give you the gist of MACD. Hopefully you should be able to analyze the Hindaclo chart with this explanation.
MACD - Moving average convergence and divergence is a momentum indicator which attempts to follow the trend. It has 4 components..
Component 1) 12 day exponential moving average - This is the shorter term MA and tends to react quickly, sticking closer to the current market price
Component 2) 26 day exponential moving average - This is the longer term MA and tends to react bit slowly hence stick slightly away from the current market price
Component 3) The difference between the 12 day and 26 day ema is called the 'Convergence and Divergence Factor' (CD) which changes on a daily basis as and when the values of 12 and 26 EMA changes.The CD is plotted as a line on the MACD indictor.
If CD increases in value, that means the 12 EMA is higher than 26 EMA hence the trend is upward and likewise if CD is decreasing in values that means 12 EMA is lower than the 26 EMA therefore the trend is down. The CD line oscillates between positive and negative territory with a zero line in between.
Trade rule (1) If the CD line passes over from the negative territory to positive then buy. Likewise if the CD line passes over from positive to negative then sell.
Component 4) Now traders got a little impatient to see which way CD moves and then take a trade based on it...hence decided to take a 9 day simple average of the CD line. They called it the signal line. The signal line is overlayed along with the CD line ...this appears as two moving averages on the chart.
Trade rule (2) Buy when the signal line crosses over the CD line from below and sell when the signal line crosses over the CD line from above.
The job of the signal line is to just identify the trend as early as possible.
I've given the Hindalco chart a good look - based on what I can see, I'd have been a buyer in Hindalco (intraday) based on MACD...becuase...
1) Signal Line has crossed over the CD line indicating bullish momentum
2) Volumes were good
3) Presence of bullish candle.
I hope this gives you the required clarity.
Good luck.
PS - Given that this is a platform to learn, please do not trade on what I've said. Suggest you observe, learn, practise and then implement.
5 Likes
I need code for this logic for Pi software which i can use for Alert indicator
Thank you very much Karthik
Karthik,
Please provide me the code for the logic of EMA (12,26) and MACD (12,26,9) crossover alert signal BUY/SELL signal in tradescript code, if available already in there please let me know the link to download it.