Hi Team
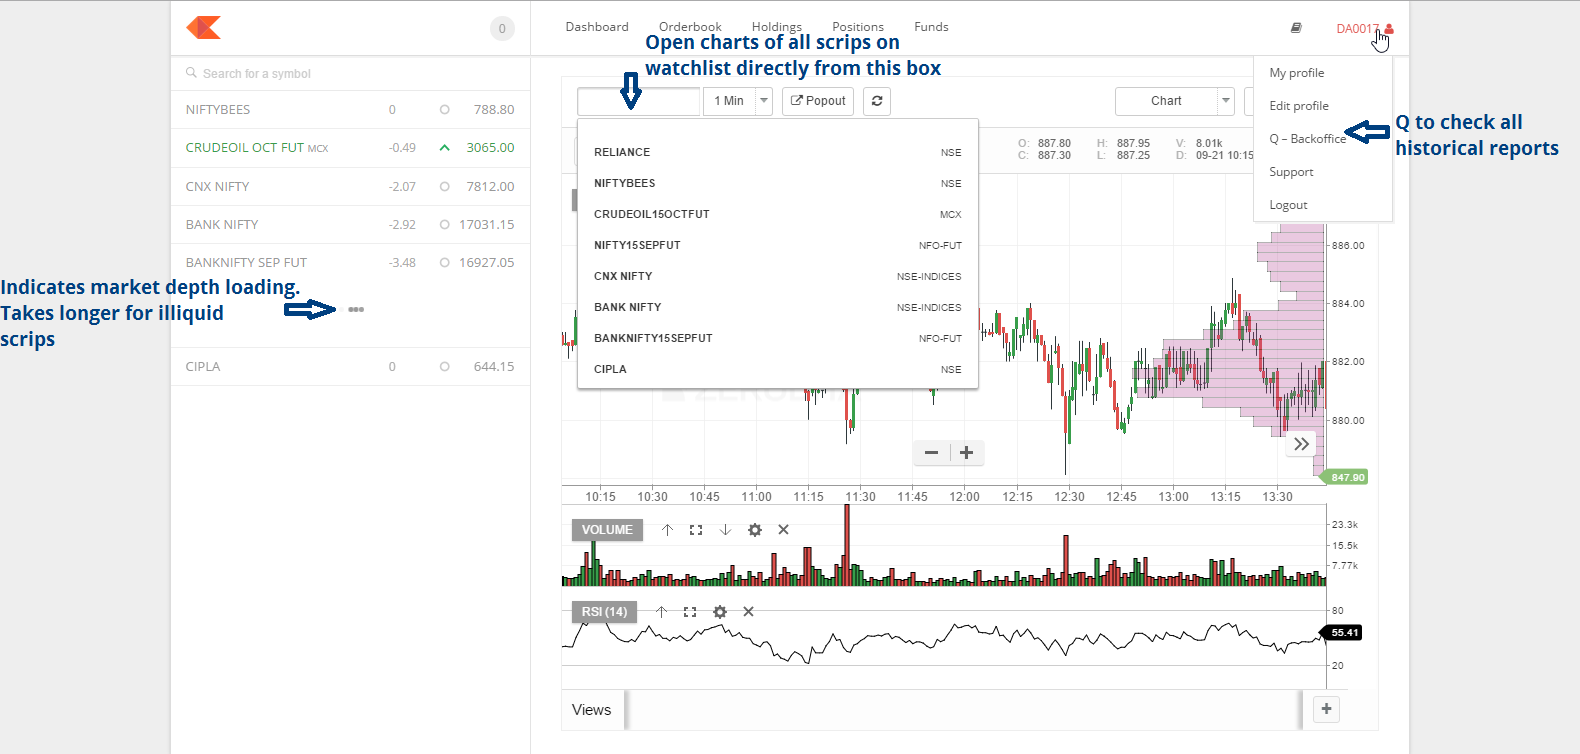
Can anyone tell what is the Horizontal Graphs that are in the Chart which is shown below
Thats Volume Profile. While Volume shows the amount of a security traded during a given period of time, Volume Profile on the other hand displays trading activity over a specified time period at specified price levels.
Thanks tryszu 
It’s similar to the concept of Market Profile, which has picked up significant following among index traders over the past few years (though it was designed way back in the 80s). I had a hard time following it at first (because it doesn’t have a time dimension to it) but once you get a hang of it, it can be a great chart/tool to look at. I typically use it on range-bound days for taking boundary trades on NIFTY & BANKNIFTY.
Please note that Zerodha only provides the volume profile and for the Market profile, you would need a charting tool like Amibroker.
These fellow traders have written good articles on this topic. Check them out…
http://www.marketcalls.in/market-profile/how-to-read-a-market-profile-chart.html (in Indian context)
This one, in general–>
Cheers!
Neha (www.VRDNation.com)
How to interpret Volume Profile, is there any article which can give in-depth analysis?