Can you share an overview of your trading strategy?

Contest#1, ending 2nd July 16

To make learning fun, we are starting a contest on http://tradingqna.com/. One question will be asked every saturday and the best answer will win Rs 10,000 in cash on the following saturday. 

Do participate and invite your friends. I am guessing will help all. Contest is open for everyone trading on the exchanges. We will contact the winners on the email address used to register while creating a tradingqna account.

To improve your winning chances, don't keep your answers extremely long, add images/graphs, keep it as interesting as possible. 

Looks like there are a lot of answers being downvoted in order to game the contest. We will not be taking into consideration, the number of upvotes or downvotes, but instead will be judging the merit of the answers themselves.

Winner : C.D.Moorthy

@Mr Moorthy, we will contact you on the email ID that you have used to register for the  cash reward. Alternatively, you can also reach out to us, send an email to [email protected]

Thanks everyone for participating. Contest #2 is now open, click here to answer. 

51 Likes

For long position:

Monitor top 5 sell orders. If you find the sell order volume >0.8% of the daily average volume, put the SL buy order with trigger price immediately after that big sell order. What this means is that some high net worth individual is buying a big lot. From my experience, 90% of the time price jumps atleast 0.5% above trigger price. This is very low risk, high accuracy trading strategy.

2 Likes

Hi,

I am a discretionary price action trader and I try to catch impulsive swings of short term trend in a given time frame..  I look for 4 things every time.

1. Short term bias,


2. Corrective move against the bias.

Determining whether the move is corrective or impulsive is a bit subjective.

3. Price levels from the previous Impulsive swing to time the entry.

4. Targets.

I use three timeframes. 1H to define the S/R framework, 5min. to define the short term trend and the setups, 1min. to fine tune the entries (I rarely use this 1min. timeframe.)

10 Likes

My entry strategy is based on technicals, but use different position size.


I use supertrend on a 1 min chart to determine when to buy/sell. Since supertrend tends to chop you if there is no clear up or down trend in the market I do a bunch of things.

1. If only supertrend gives a buy/sell, I take position with 1 lot. I am always stopping and reversing, so if I have bought and I sell, I not only sell but also take a fresh short.

2. If supertrend gives buy/sell when the stock price is above 200 EMA, I take position with 2 lots.

3. If same time on volume profile, I see the buy/sell coming at maximum volume compared to other prices on the chart, I take 3 lots.

Also I use streaks which is available on Quant to determine my position size. My longest winning streak is 10 days and losing is 6. So as and when I start going towards 10 days winning streak, I start reducing my position size. Similarly if I am on my 6 th day losing, I increase my position size.

This has been working quite well for me. It also ensures that when I am getting chopped, I am doing it on my smallest position size.

Where I am struggling is that when I increase my position size, I start thinking with my balls. :)

15 Likes

Its not all about the trading strategy.To be honest, no one will share their successful trading strategy.Because successful trading strategy depends upon their own personality and experience.
But there are principle trading strategy which suits my trading style because there must be some basics to follow to create your strong base for your trading style.
So below are some points:

1) In trading, money is in the exit.

2) I use time stop than using stop losses.

3) Sell your position when you find a much better trade with a better probability of success, or a bigger upside. 

4) The key is to always have a plan to get out of every trade before you get in.

5) Patience  is the king of all.

"Most traders take a good system and destroy it trying to make it into a perfect system– Robert Prechter"

P.S.: No trading strategy is perfect, just learn how to use it perfectly.

15 Likes


My trading startgy called "trande is your friend"

this is globale event day (BREXIT) BANKNIFTY FUT. chart, with my startgy.

my trading startgy never volatile extrmly simpale day for trading. with my trading startgy simply enter in sell side around 09:15 and got 200 point in sell side and then buy side entry at 12:45 got 300 point in buy side.

D'ont ask how to draw thise lines.

:)

5 Likes

Simple basd on ema’s in Day Time fram - Price cross 3 & 5 ema’s along with 10 ema’s.

(1) Long If price is above all this ema’s, for short position wait when price come below the ema’s.

(2) Short If price is below all this ema’s, for long position wait when price come above the ema’s.

For entry wait for Price close above or below ema’s, check 2 or 5 min time frame (chart use Google finance)

5 Likes

90% Options Expires worthless, So Option seller have higher probability of winning.
Trend is your friend. and Controlling Greed and Fear is one of the key to Successful Trading.
Chart Daily: Bollinger Band (20,2), Supertrend(10,2) 

Strategy :When Supertrend gives buy signal, Sell Put Option which is out of lower Bollinger Band.
             
 When Supertrend gives sell signal, Sell Call Option which is out of upper Bollinger Band.

Money Management: Don't risk more than 2% of capital on any single trade.
Cover your position before any big event like : Election, RBI meetings, or BREXIT ;)

15 Likes

Strategy (Trading The Trend)
Simple and effective strategy it is.
it will not make you multi-beggar in 1 trade, but it's like actual trading what a normal retail Grocery shopkeeper do.
Lets Begins...(for better resolution of Images Click on plz Links)

I find Trend according to RSI Levels and trade Accordingly. Finding trend on Bigger time Frame (Daily/Hourly) and trade the trend on small Time Frame (3/5/15 Min) Until RSI Reaches it's Next Levels (Over Bought/Over Sold).

          1. As i will only illustrate only 2% Returns/Day... and it will give you more than 40% returns in a Month..
Capital Required 5 Lacs (Exactly 5 times of your single trade, so you can average your trade 5 times if goes opposite to your expectations)
Trading Capital 1 Lac Approx.
Example Crude Oil 5 Lots
Daily Target 20 Points (no matters you do 4 Trade for 5 Points, 5 trades for 4 Points or 3 trades for 8 Points )

           2. Charts One Hourly Time Frame(Trend finding chart) http://prntscr.com/bkzqxw


If you will see according to RSI Divergence (Negative/Positive) it set trend for the chart for Next few Days till RSI settles down .
and once we got Divergence we have to trade the Direction, means on Positive RSI diversion it's Buying on Dips and on Negative RSI Diversion Sell on Rise, becoz we know ultimately charts has to follow the Trend.

Marking on RSI and on Chart is RSI Diversions.
Positive Diversion= Price making lower low and RSI makes Higher High (@ Over Sold Zone only)
Negative Diversion = Price making higher High and RSI making lower low (@ Over Bought Zone only)

         3. Charts 3 Min time Frame (Trading chart) http://prntscr.com/bl06wo


As i am talking about purely Intraday Trading.
we got nearly 8 very very Safe Trades according to our strategy on 24 June 2016 and out out them we can at least trade 3-4-5 according to our Points per day that is 20

When ever RSI Starts Going upside from Over Sold Zone and we got STOCH crossover confirmation in deep downside We Take Buy Position for only 5-10 Points(According to 3 min Chart it's safe to play for 5-10 point, we can trade for 40-60 Points on 15 Min/Hourly Time frame)

and whenever RSI Comes Downwards from Over bought Zone we take sell position.....

but always remember RSI Direction is most most important Don't Take opposite trades and leave aside your greed..

Fibonacci Retracement is also helpful in finding the Limits and levels of Getting into the Trades and putting SL and helps in doing Averages in your Trades..
always Use it.. it works also fine in Intraday trades in sideways markets and perfectly works in hourly and daily Charts.
Rest if anyone want to cross check my strategy based on my tools and Analysis. go to Investing.com and see my view on Nifty for the October months of last year. http://in.investing.com/indices/india-50-futures-commentary/9
http://prntscr.com/8wpnqf


for complete comments plz visit the Link nd you will be amazed that how perfectly these tools and indicators works.

9 Likes

Hello Friends!!!

I trade only in MCX and I use quite a unique combination of Standard deviation,volatility and Fibonacci ratios to arrive at a method for my trades.

I call it the “8 ladder”method because it has 8 important levels on both buy/sell sides.

This same method can be used for weekly positional and monthly positional trades as well.

8 ladder” tells me precisely where to enter and where to keep my stops and i book profits once i spot divergence in price chart and another custom indicator called the TSI - Trend Strength Indicator.


I can't reveal pictures of 8 ladder system as it is copyright protected.

I don't keep any specific targets in mind as it creates additional pressure in your mind.My charts will show when to book it and till today i'm happy to say that its winning.

Thanks for reading.

Happy trading!!!

2 Likes

POWER OF MOVING AVERAGES

Sharing this simple yet powerful strategy to trade consistently any market. The strategy can be applied to any timeframe in any market.

Description-   A moving averages often act as a serious support and resistance. The 20 and 50 Moving average often act as a floor for the scrip or market. The price bounces from it generally. The risk reward is great if we can buy or sell at nearest to moving averages.

Strategy- In this strategy i am using 4 hour chart. You can use any time frame. Larger the time frame better the results are as you will eliminate unnecessary noice. Below is the example of Nifty 4 Hour charts. Plotted 20,50 and 89 Ema, Slow stoch and ADX. This strategy in for postion and swing traders.

Here you can buy as price touched 50-89 Ema and bounce back when stochastic is oversold. Risk reward ratio is good. Exit if trend reverses and price fall below 89 ema. Risk reward you can take 1:2-2.5. On observing this chart you wil find out that how moving average act as a serious support or resistance. Same with any scrips.


Simple things are powerful and effective one. moving averages are like sustitutes to trendlines.

Thank you.

6 Likes

Trading is easy if you can keep it very simple.

My strategy is like this: 2MA Method:

Setup is like this:

It is double time frame system:

Like: Day chart with weekly chart; 3 min/ 5 min chart with 15 min chart; 15 min chart along with 60 min chart

Setup:

We will use SMA 21 & EMA 8 in both Time frame chart.

When in higher TF chart; price above both the MA line, buy in lower TF when price break out of the both line above it.

When in higher TF price below both the MA line, sell the lower TF when price break down / break a pivot low (when price below both MA line in Lower TF).

I will post some charts for this setup.

It is very easy setup if you know & remember the Rally & Decline.

NF 60 min chart

http://i.imgur.com/7i54m6X.png

NF 15 min Chart:

http://i.imgur.com/xxtzM3S.png

At point A, in 60 min chart you can see that price move over the sideways move of the previous days- also move above both the MA line.

Now look into 15 min chart:

Entry above point A, SL two bar low; 1st ADD over point C;
From entry point look for rule of Rally and decline;

We will get out when there will be decline or our exit rule of whatever I have told previously.

second add over point D -some how half cut Description: http://www.traderji.com/images/smilies/frown.gif in the picture.

Point E still no decline, one bar after point E, decline not confirmed..

At point G, exit.

For earning big money, go for 15 min/ 60 min charts, trade seeing those only.

But for excitement, you can trade 3min/ 15 min chart- more trades...but if you can manage Money management well, you can do wonder.

Entry Rule:

  • When Higher time frame chart price above both MA line
  • at Lower TF, if price above both MA line & breaks a pivot high
  • at Lower TF, when price breaks above an aggressive pivot high
  • Entry always at lower TF chart


Exit rule:

  • At lower TF chart if pivot low broken
  • at Lower TF, if decline confirmed
  • in lowerTF chart price in key price point- e.g. NF at 8000, 8500 etc


All entry and exit should be same in whatever chart you trade, but trade should be seeing higher TF chart and entry done at lower TF chart.

For bear entry just the reverse.

No it is not a crossover method. 

Price closing above both MA is sufficient.

5 Likes

Its simple…just have 1,00,000 capital. 1) make your mind for 10,000 losses…means it about 10% loss Then the strategy comes up. Buy 900 shares of 8200pe or 8300ce.whichever trend of the day.and put stop loss of rs.1 and target of rs.1. For e.g.if 8300 ce is at 70 . Buy & sell quantity 900. Buy price 70. Sell price 71. Stop loss =69. Trade time between 10:10 to 11:55 …its stable period. Total profit = 900 after brokerage (-160)= 740 Total loss= 900+ brokerage(160)=1060. So you are planning your profit and loss.thats the strategy. ================== Also if it is intraday. equity then brokerage will be 40 …so again Rs.100 profit.extra. =================== Note- no market risk…nothing.stick to your plan. by amol temgire Email: [email protected] If you are in good profit because of this strategy…then share some with me. :slight_smile: Also warren buffet quote rule no.1 :"never loose money. Rule no.2 : never forget 1st rule

3 Likes

 To begin with my strategy just includes trading Nifty futures as it meets one of the most important criteria of trading - Liquidity. Also this strategy is purely for intraday trading. When we talk about trading strategies I have always believed in simplicity. The more simple a strategy is the more flexible it becomes to tweak it as per market conditions (such as widening of true range, increase / decrease in volatility. First I lay down the constraints and criteria before I put down in my strategy.

  1. Liquidity: The security to be traded is enough liquid. Nifty satisfies this condition.
  2. Simplicity: It must be simple to enable quick decision making. A good strategy is always with less number of indicators. This strategy doesn't require any indicator apart from one.
  3. Strategy Operation Cost: One of the most important challenge for me was to be able to trade Nifty with this strategy without any geeky looking, pricey trading software. We don't realize and take into consideration the capital outlay for the trading software that you use to crunch the data real-time while calculating the overall profitability. If your strategy does not work the expenditure on such applications go bad. You don't need any software to play with this strategy. Just the basic trading application will do. Recommended: Kite or Pi
  4. Low transaction cost: One of the most important criteria. Zerodha satisfies this.
  5. Ability to Trade from anywhere: A full time trader must know how to trade when there is no internet or a computer. I also put this as an optional constraint that what if you just have a basic phone and want to trade using this system you should be able to.

Having broadly stated the constraints let me now put the strategy which is known as the "Opening Range Breakout" (ORB) Strategy. This is not a new strategy and is widely used by traders across the globe. I have fine-tuned the strategy to meet trading Nifty. I shall right away begin explaining in a step by step form how to trade using this strategy.

The recommended software for this is Zerodha's state-of-the-art Kite and Pi

  • The chart should be of intraday and on a 15-minute candlesticks. Start your day by just witnessing the price actions between 9:15 AM to 9:30 AM
  • Exactly when the first 15 minute candle is formed create two horizontal lines, one at the Highest price of the candle and second at the Lowest. Your chart should look like below. If you don't have access to Kite just note the Highest and the Lowest price observed during 9:15 AM and 9:30 AM.
  • Apply SMA-40 on Volume chart.
  • Now all you have to do is just wait for the breakout. We initiate a BUY on the next candle Open when the Price breaks out the upper range and closes above it along with Volume more than SMA-40. Conversely, we initiate SELL on the next candle Open when the price breaks out the lower range and closes below it along with Volume more than SMA-40
  • Profit taking - After trading full time since 5 years I feel no hesitation in saying that you would be the happiest trader taking 10 points in Nifty every day. There are many versions of profit taking though using this strategy. Sometimes it also pays off to keep holding till 3:00 PM but more often than not if the trend changes in the middle you can hit the stop. However, I would go for just 10 points. So the first order using this strategy will always be a Market Order and the trade will always be closed with a Limit Order.
  • Stop loss - For Long trades: When the opening range is more than 50 points my stop loss is the close below the mid-point of opening range and when the opening range is less than 50 points my stop loss is the close below lower range. For Short trades:  When the opening range is more than 50 points my stop loss is the close above mid-point of the opening range and when the opening range is less than 50 points my stop loss is the close above upper range
  • Also to check the general trend I use SMA-50 & SMA-100 on the Price chart and the Price should be above the High of the latest gone Expiry Day for an uptrend OR Price should be below the Low of the latest gone Expiry Day for a downtrend. If it is in the middle of the High-Low of the latest gone Expiry Day I take it as sideways which also forms a part of an another strategy called Expiry Range Breakout (ERB) but it isn't for intraday trading and I am in the process of fine tuning it. 

No strategy is perfect and is bound to have whipsaws. Trading overtime and sticking to only one security gives you insight about its behavior and helps in decision making. It's like if you spend maximum time with a girl you get to know what makes her mood swing and you start getting better in guessing how she is likely going to behave. Loving your security and being faithful to it works. 

A trader of security is just like any other trader of any commodity or product. Rather dreaming of getting rich overnight he is better off developing an attitude of being able to trade every day with a decent profit.

Market gives you what you deserve not what you ask for.

Of course this was just an overview and not a detailed report of the trading system along with the back testing. Nevertheless, it lay down a decent foundation. 

A lot of improvement came from reading a research paper titled "Trading System Development: Trading the Opening Range Breakouts" by Mehmet Emre Cekirdekci and Veselin Iliev at Worcester Polytechnic Institute.

16 Likes

I have an entry and exit strategy based on Supertrend and backed by a SMA crossover. The strategy works quite well with Nifty, not sure if it's universal.


So, the red line is 13 day SMA and the green line is 8 day SMA. The periods are chosen from a Fibonacci sequence. Whenever the green line crosses over the red, I take that as a signal to go long (buy calls and sell puts) and vice versa. 

I act on the Supertrend buy/sell signals and use the SMA only for confirmation.

As you can see, both studies give buy/sell signals at almost the same time, so I can make small profits through the day.

10 Likes


(Trades in last 1month)

Index trading chart snapshot which is based on volatility checks. Most of the times, losses are small and big profits can be made when we get a good trending market as observed in charts.

This particular trading strategy captures the tops and bottoms most of the time as observed in charts.

Important points to note

1. when markets opened gapdown on 20-06-2016, trend was in buy, while many shorted seeing gap down.

2. Similarly before the Brexit day, Trend was in short but most people anticipated a buy and had gone long.

3. On Brexit results day, while most people started shorting in panic, My strategy posted a Buy and still in buy.

This is purely index based strategy which works on Nifty and Banknifty.

Yellow star indicates Buy entry point and White star indicates short entry point.


3 Likes

Hi , I trade base on waves. I will have the levels and trade as per level. Small stop loss should be the Strategy for trade in both side. I check the volumes also more selling or more buying… Yes i am new to all these things.

2 Likes

Hey guys, 

I would like to answer this question. 

Honestly, I feel this is not the right question in the first place. 

As far as my knowledge goes, there are thousands of trading strategies that work in the market. A simple google search will throw up back tested ones with good profitability in any time frame of your choice. ( I speak purely for technical analysis here ) 

The moot question here is can you share an overview of how you trade your trade strategy ? 

Having a trading strategy constitutes just 1 % of being a successful trader. Trading it as it is meant to be constitutes the other 99 %. 

This is where the real challenge lies. This is what separates the winners from the almost winners ( Dont we all, almost always, delude ourselves we are here ) 

if you were to ask me the first thing you must do right now i would say, STOP LOOKING FOR THE NEXT TRADING STRATEGY !!!

If youre a newbie, read ONLY ONE book on technical analysis( google and find any author who shows up on the first page or has the best amazon reviews )

Choose any ONE indicator that you feel you may want to work with. Dont stress too much on which one. Remember that there are just 3 real indicators in the market : price, volume and open interest.

Everything else is a derivative of these anyway. 

Now here is where your personal interests will come into play. 

If you are like me, you will choose the following path. 

The book that you have read will have a lot of strategies defined in it anyway. 

Trust me when i tell you they all work and you need to just choose to implement them the way the book asks you to do it. Period. 

If you are the researching kinds who needs to feel the power and propriety over his strategy, then you will have to follow the long drawn out process of backtesting and trial and error to develop it. 

I have done this too successfully and honestly its not for the faint ( and cash light ) hearted ( the reason i say this is because in hindsight, you do not need it !!!!! I wish someone had told me this earlier that i am here to make money and not make strategies and feel like Xerxes in the movie 300 with men holding me on a throne ) 

Next we come to the implementation stage. 

Here is a practical suggestion I feel should work since it has worked for me. Im certain it work for you because my IQ is just a little more than that of a dung beetle : 

1. Choose a timeframe based on your trading style ( intraday, swing, positional whatever it may be, choose the appropriate time frame in which you would take your decisions currently ) 

For eg, Swing traders may want to choose a 30 / 60 min timeframe for strategy and a lower timeframe ( maybe 5 /15 for Entry ). This is just a ballpark i have given as per my own limited trading experience. 

2. Choose just ONE out of all those strategies in the book that you feel are the most comfortable with.

Not TWO. Just ONE. 

3. Now trade this strategy like it is the truth handed to you by God himself. BUT HERE IS THE REAL CATCH : 

God will tell you my strategy works. Keep doing it faithfully and you will make money eventually on a net basis. 

But maybe, just maybe, this time it wont work. Can you accept that ??? 

If you can accept this and still soldier on, Congratulations !!, You are on the path of becoming a part of that 1 % which is going to remorselessly suck in the money of the remaining 99 %

If you cannot, then you know which side of the equation you will eventually belong to. Dont believe the fact that you made a profit today, or yesterday, or this whole week or month without a working plan. If your goal here is to make monster money consistently ( which is what it should be ), then unless you have followed a strategy which you implement over and over and over again, you will eventually give back everything you have earned. 

If you ask me to predict one thing about the market that will be true 100 % of the times, then it is the above statement.

And thats it.... !!! 

Funny as it may sound, thats all there is to it. 

Ya, and one more thing. When you try and implement this, you will doubt it each and every second. 

You will want to do everything to violate every rule you set for yourself and what the strategy says. 

But hey, unless youre an atheist, God gave this to you right. So follow the damn thing :)  

As George Carlin famously said - " Tell people there's an invisible man in the sky who created the universe and the vast majority will believe you.Tell them the paint is wet, and they have to touch it to be sure " 

So stop doubting this strategy you chose for yourself and just implement it to the hilt NO MATTER WHAT AND HOW YOU FEEL. 

Do this for about 25 trades and check your P&L at the end of it. Till then DO NOT, I repeat, DO NOT check your P&L. 

Let this also be a training. Set aside money that you may lose to gain this mindset. you will definitely falter. what will determine your success eventually will be the degree to which you follow or falter. 

Acquiring that mindset to follow a strategy is a transformational process. Dont go too hard on yourself if you succumb initially. And i dont say this because i want to give you some pop psychology decree. Its because it will 100% lengthen your process. so you make the choice now. 

Remind yourself not to feel negative because its wrong. Yes, its wrong to feel negative about yourself. This is not you. This is just your competence. You are not a trader. You work as a trader. Its not your natural state and you dont seek it. you will feel it anyway but just ride it through till you feel neutral. These energies will eventually subside. You will see the same action and loss doesnt cause you that pain anymore. 

Anyway. I hope this works. I have seen many friends around me crash and burn only because they havent taken the time out to see that the problem lies with their unpredictability and not that of the market. I hope you can realise this in time to build massive wealth for yourself and the life you want. 

P.S.

Since this article is about trading strategies, ill anyway just give you an overview of what is mine and trading rules i try and follow diligently. 

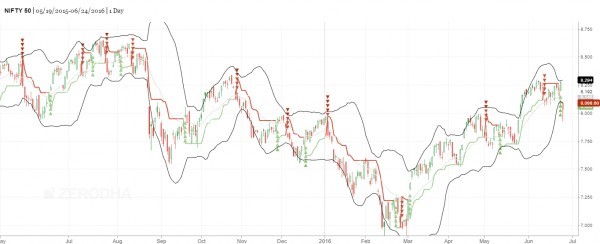
1. Swing trader on Nifty Index.

2. General time frame of trade - 2 - 5 days 

3. Indicator - Only price ( candles ) 

4. Accuracy - 35 % ( You dont want to try and be right. You want to try and make money ) 

5. Risk : Reward Average : 6 : 1 

I am profitable since the last one year and have been trading full time for 2 years. 

This data can be confirmed from Nithin.

Regards

Akshay Iyer

32 Likes

Simple strategy works well most of the time,Right analysis of news/ what’s happening around the world and domestically,analyze without any bias or greed, Contrarian views works well in the market, along with the stocks analysis based on Technical charts and capital management is my trading strtaegy .

2 Likes

First of all trading is not everyone cup of tea, i am doing trading for last 3 years, i only do trading in nifty futures and its options, never buy or sell stock futures, i do trading as i did investment, i even hold my position couple of months, trading startegy: buy when the blood is running in the street and stay away from markets when it is reaching optimistic levels,markets are slave to earnings but nothing comes in front of momentum, i never try to go long in market when momentum is against it,just wait market will give u enough buying opportunity,go long when everyone is crying about nifty will fall more and more: my another rule which i always follow is good news in markets always come when valuations are low and bad news always comes out when valuations are very high: i built my portfolio in cash market when blood is running in the street and always sold it when cats and dogs are buying: third : market is much smarter then u and me ,it will always find value : fourth:liquidity can even create a bubble in market and markets can go higher even upto 29 to 30 pe but u should know when to invest and when to sell: stock markets can give u better returns then fds only if u bought it in panic: i does not try to be intelligent in market but i am not stupid at all

6 Likes