I used to avoid intraday as I am a begginer and have very less knowledge on analysis of patterns and charts i used to go with long to short term investments in company which are under valued based on their technicalities and market conditions and future scope of development ,management also . its all about stock picking and not market trend , other economic effects.
I use moving average crossovers,fibonacci tools, MACD and RSI for analysis. Swing high/low of fibonacci tools is identified using the support/ resistance levels, crossovers in MACD , RSI and candle sticks.
Of course we can share an overview of our trading strategy. But be careful, there is no one size fits all theory that is applicable, when it comes to trading strategy. If you think you can trade somebody else’s strategy, then you are mistaken. We all trade according to our own personality. And our personality is made up of our character and beliefs. Any trading strategy speaks of belief and personality of that individual trader who developed that strategy. Hence, it is imperative that to be a successful trader, you need to develop your own trading strategy according to your personality type. If it is not in accordance with your personality, you may start off trading the strategy but will ditch it later during the lean periods, when the strategy will not give the expected results. Almost all the successful traders develop their own strategy and they all talk of discipline. One of the factors I see is that only if you develop your own strategy, you will trade with conviction, and only if you can trade with conviction you will be disciplined.
It is not only the trading strategy, but also the trading principles you follow, that is important. You can always follow the rules or principles followed by the successful traders and within that framework should work out your own strategy. Though the genesis of a successful trading strategy is a very well back tested plan, the final strategy is always derived by the trial and error method. Once, the strategy is laid out in theory, the strategy is tweaked after practically trading the same to suit your personality.
1 Like
Dear Zerodha,
Nice Initiative for traders strategies reveal through this contest . I think practically traders who are making money they never reveal their trading secret. This contest may useful if any body doing with their strategy for adding riders or modification for better results only. But there are lot of strategy traders are using each different style. But finally how many are getting money over a period. Investors and Long term investors who was invested in good stocks never lost money. My uncle invested in SBI at 110 and taken yes bank IPO at 46. Investors only ultimately getting money in markets(Long term with good stocks). Traders have stop losses and dealing with huge quantity or using derivatives. Each day almost all derivatives High and Low difference amount is minimum Rs.10,000 . So if any body attempted they may get or loose the same amount. Risk involved. For these purpose lot of people using charts, data analysis , Algo trading(Without strategy also trading also can't do any thing), Price action based trading, Scalping , Hedging with options, etc.,, If you see options there are 135 strategies but no body getting money because in that strategy also works different markets different style. ULTIMATELY OUR LEDGER SHOULD BE INCREASED IN TRADING.
Yesterday I saw Junjunwala meeting conducted in Pune last month video. If you ask him all the questions he did not told his investment or trading secret. Only he telling learn and earn. And also he told several times in that meeting GOD BLESSINGS REQUIRED. Hard work, patience, etc.,, But what kind of hard work nobody explained.
Every body using different kind of charts for scalping , intraday, positional, swing trading etc., But ultimate winner is positional investor only. No trader earned money (If he earns one or two times but each month his ledger should be upgraded amount wise).
But for this contest participants satisfaction I am posting one chart which is take 5 minuts chart, (Intraday purpose), Bank Nifty, apply EMA 25 close, 100 simple average Low then you come to to support and resistance levels there.
This is Intraday chart 24th -June given buy call at 17080 to 17585.
Welcome comments!!!!!!!!!!!!
2 Likes
Trend is your friend. This is the theory iam using.by following trend we can gain more.in the process i learnt to overcome my weaknesses.
2 Likes
Hello friends Always be patience while trading. I always do intrady and take holding if it extremely necessary. Never ever sell/buy in loss. Book at least some profits… For this you have to follow the movement… In upside buy,in downside sell. But not trade in opposite direction, fell free to trade…surely you never fell bad for that trade.
My Trading Strategy is simple and safe.
Look at a stock which is facing resistance (at higher level)
Buy the stock as delivery at a lower level.Then every day sell do sell on rise.Generally at opening hours the stock rise will be high.So try to sell it by 930.
Wait for the whole day to get a reasonable gain to shortcover.Even if you dont do shrt covering ,it will be considered as a delivery trade.So you will be safe.But keep a permanent stop loss.
Similarly buy a beaten down stock near its support level.(For Ex. Dr Reddy at 2900-3000) Do sell on raise. Again keep a stop loss below support level(For Dr Reddy it is say 2850).
Keep yourself news updated to avoid losses.
3 Likes
1.Day Trading:Day Trading is perhaps the most well known active-trading style. It’s often considered a pseudonym for active trading itself. Day trading, as its name implies, is the method of buying and selling securities within the same day. Positions are closed out within the same day they are taken, and no position is held overnight. Traditionally, day trading is done by professional traders, such as specialists or market makers. However, electronic trading has opened up this practice to novice traders.
2.Position Trading:Some actually consider position trading to be a buy & Hold strategy and not active trading. However, position trading, when done by an advanced trader, can be a form of active trading. Position trading uses longer term charts - anywhere from daily to monthly - in combination with other methods to determine the trend of the current market direction. This type of trade may last for several days to several weeks and sometimes longer, depending on the trend. Trend traders look for successive higher highs or lower highs to determine the trend of a security. By jumping on and riding the “wave,” trend traders aim to benefit from both the up and downside of market movements. Trend traders look to determine the direction of the market, but they do not try to forecast any price levels. Typically, trend traders jump on the trend after it has established itself, and when the trend breaks, they usually exit the position. This means that in periods of high market volatility, trend trading is more difficult and its positions are generally reduced.
3.Swing Trading:Swing trades are usually held for more than a day but for a shorter time than trend trades. Swing traders often create a set of trading rules based on technical or fundamental analysis; these trading rules or algorithms are designed to identify when to buy and sell a security. While a swing-trading algorithm does not have to be exact and predict the peak or valley of a price move, it does need a market that moves in one direction or another.
4.Scalping:It includes exploiting various price gaps caused by bid/ask spreads & order flows. The strategy generally works by making the spread or buying at the bid price and selling at the ask price to receive the difference between the two price points.
1 Like
I was watching CNBC and heard one expert saying “Investors should stay out of market when such a position (Brexit) happens…..blah, blah…….”
But according to me it’s the best time when you can buy wonderful companies at wonderful (cheap) prices.
I put my money on Tata Steel exactly at 300.
Why?
It was the top loser at that time.
I was lack of fund (I already have my money invested in many stocks) but still I sold Cipla to but this share at such a great drop.
Stats of Tata Steel were as follows…
- Previous close - 333
- Open price - 307
- My buy price - 300
- It’s current price (3:00 pm) - 314
There were many share in the list of top losers…..
- Tata Motors
- ICICI Bank (I was also thinking to buy ICICI but I already have this share in my portfolio bought at 216)
- Axis Bank
- Larsen
- So on….
All are great buy at respective prices.
Also try to stay away from govt owned stocks at such situations.
Now let’s look over the reason - Why Tata steel dropped so much?
We all know that - BREXIT (exit of Britain from Europe Union)
Especially, Tata Steel was affected the most from this because….
And I was waiting for this movement since last 2 days, when I heard this news….
I also invested in Motherson Sumi at 276 by selling SBI from my existing portfolio.
You can see the position, per share gain/loss, % change of my orders as follows.
So I presume, that’s enough to clarify “Buy Top Losers Sensex Shares”. And this was strategical trading experience on BREXIT day.
(This post was first appeared on my blog)
4 Likes
According to me, trading is an art and skill development over time with experience. It need lots of patience to enter a right trade. The point to remember while trading is risk /reward ratio and how to manage the trade once entered like moving stop loss in safe jone. Risk / reward ratio should be at least 1:3. So if we are right in 50% of our trade! we can make money. All the planing of trade should be done before entering like entry, stop loss and target. I use bracket order for this. Thanks Zerodha for making trading easier. I use trend line to plan my trade. Long entry near support trend line and short entry near resistance trend line. Which gives me the best risk and reward ratio.
Thank you.
3 Likes
I am a Data Scientist, I just know Statistics. I applied Time Series Algorithm to find forecasted values for next few days for some high beta stocks only and most of the time it works, small gain is better than negative gain.
Anil
Client ID: RA6982
1 Like
My stretegy is simple as to make portfolio of stock by industry wise and also comapny wise example as follows: -1000 share of banking sector Under banking as follows public sector: 300 share of sbi 200 share of bob 100 share of indian bank privet sector: 300 share of icici 100 share of kotek m bank - 700 share of automobile sector 200 share of tata motors 500 jamna auto - 300 share share healh sector 200 narayana hrudayalaya 100 lalpath lab And such as… Make previosly flow and trend of stock, buy at lower price and sell it on high price. Make investment in best stock they surly go up.
1 Like
Given the way the question is framed, my answer is:
“Yes”.

1 Like
My trading strategy is using Elliott Wave theory, i have been applying it on multiple stocks, commodities from last 1 year and it has proved to be helpful for me. It is applcable on all time frames, be it a minute chart or a 1 decade timeframe chart.
1 Like
by looking at open interest and various external and global factors. prefer scalping. Booking partial profits time to time, so that not regret if the position goes to negative territory.
I follow simple trading strategies on Nifty Options. Finding support and resistance levels for near the money strikes and keeping a watch on them. If one strike ce/pe reaches a support/resistance levels and another strike pe/ce reaches resistance/support levels, I’d take buy trade on the strike which is near to the support levels after watching price-volume action in both the strikes. eg: if 8100pe is near support and 8300ce is near the resistance levels, I’d keep a check on price-volume action of both these strikes chart and initiate a trade on 8100pe after it shows a reversal pattern and keep stoploss below the support levels.
3 Likes
i like to keep things simple not complicated , simple things are easier to understand quickly so that one can make decision actively as there is a saying too much analysis may cause paralysis.
So talking about my trading strategy i use just stochastic 14,3,3 , there are so many indicators trend indicator , rangebound market indicators nobody can use it at a time so whatever your strategy is you need to overcome your strategies to learn about onething that is market conditions which i learnt .
You need to identify MARKET CONDITIONS first then strategy should be according to it (market conditions) .
Spiritually saying if a person wants reach atop of a big mountain what he'll be doing , he'll be making strategy which 'll help him to climb to top of the mountain but he is unaware of different conditions and challenges which he or she may find in way so what this person is actually doing is that he/she is assuming the way of mountain according to his/her strategy instead of that we should know climbing only because we need to keep changing strategies according to time and challenges.
Thanx
bipin gautam
2 Likes
Does trading strategy only mean, which indicator or indicators signal perfect entry and perfect exits ?
This part of the strategy or rather the trading SYSTEM, answers only a part of the WHOLE answer. Maybe just 25 % of it.
Trading strategy or Trading system should include few more steps, other than just SIGNALS.
The following few additional steps should be able to answer, questions like :-
1. How much of the capital can get eroded, if the transaction goes wrong ?
2. Has this strategy or indicator been tested ?
3. What is the time-frame to be used or how long to stay in the trade ?
4. Are you in line within the time-frame you are trading in ?
5. Did you break any rule of your system ?
Yes, it is a trading system, not just a trading strategy.
And there could be few more questions to be answered, in addition to the ones above. For example, Stocks are more volatile than indices, so is it safer to trade in a longer time-frame for stocks, and also the quantum of exposure differs for stocks and indices as the volatility differs.
A trading system can still make money, with a simple strategy using moving averages, provided all the rules are followed of the system one has designed. One should know the amount of loss, rather than the amount of profit to be made in each transaction, before entering a transaction, as the indicator can signal you to get out with a small profit or no profit.
Then why do 90 % of the traders still fail ?
So looking back at the few questions asked earlier, let us see the answers to them.
Question 1. How much of the capital can get eroded, if the transaction goes wrong ?
Answer is keep a STOP LOSS. The trading strategy or indicator, itself should SIGNAL this. Rule number 1 should always be, that to stay in the game, there should be enough capital left.
Question 2. Has this strategy or indicator been tested ?
Answer is, use a software like Meta Trader to back test it. The indicator should show a success rate of at least 70 %.
Now combining the above 2 steps, if the trader is losing 20 per trade[ after stop loss ], and gaining just 10 per trade, he is still in profit, if the trading strategy or indicator is 70 % or 7 out of 10 times right.
[ 10 x 7 = 70 ] minus [ 20 x 3 = 60 ] = 10.
The repeated use of "strategy or indicator", interchangeably, is used because there is a misconception in the use of the word strategy. Traders thinks using some indicator is a same as having a trading strategy.
Question 3. Which time-frame has to be chosen or how long to stay in the trade ?
Answer is specific to the trader's objective and risk profile.
Using 5 mins chart, results can be seen in 45 to 60 minutes [ results means, the indicator will SIGNAL to close trade ]
Using 15 mins chart , results can be seen in few hours.
Using 60 mins chart, results can be seen in few hours or maybe the next day.
So it is upto the trader to decide [ how long he can tolerate the ups and downs or how much profit is enough ].
There are also external factors like occurrence of events [ company results, policy announcements etc ], which can influence the trader's objective.
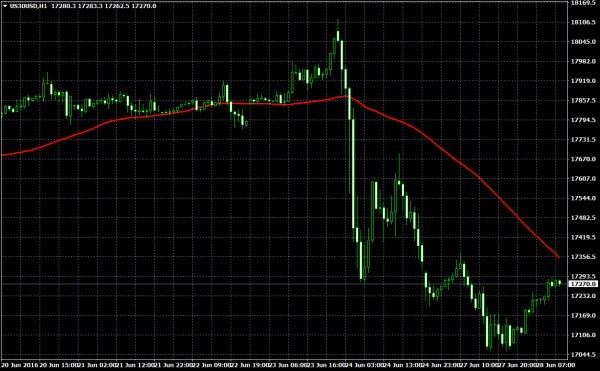
Question 3. Are you in line with the TREND of the time-frame you are trading in ?
Answer is, prices can move only in 3 directions, UP, DOWN or SIDEWAYS.
Further, between these time-frames [ 5 mins, 15 mins, 60 mins and 240 mins ], there can be a divergence.
For example, 60 mins trend can be UP and simultaneously 5 mins trend can be down for the same stock or index.
So, a very short term trader has to be very swift, to get out of a short position, as the longer period [ 60 mins ] trend is up.
And the 60 mins chart trader can look to re-enter or remain in trade, as the 60 mins trend is UP.
This is a 60 mins chart, showing trend DOWN
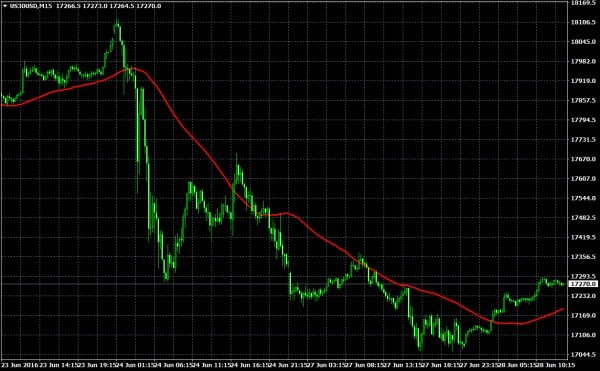
This is 15 mins chart, with trend just recovering from down to SIDEWAYS.
This is 5 mins chart, with trend UP
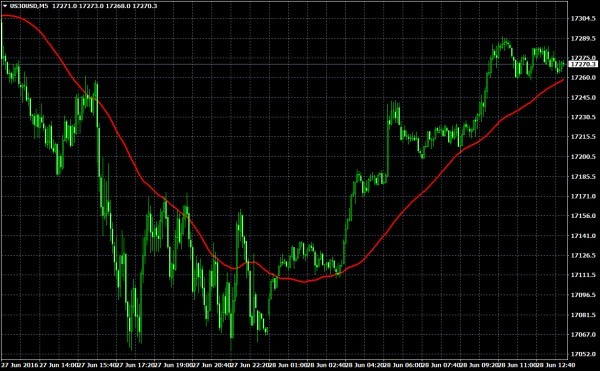
So, for the same stock , under different time-frames, there can be divergent trends.
Answer to Question . 4, [ Did you break any rule of your trading SYSTEM ? ] is the most crucial factor.
Follow the rule book, MORE diligently, for getting OUT of positions [ more than entering a new one ].
Getting out timely, not only protects your capital [and stay in the game ], but helps you to book profit and increase capital.
Exiting at stop loss level is the cost of the trade, which has to be decided before entering a trade.
So, losing 100 [ by way of STOP LOSS ] and gaining 200 by way of signal given by indicator, is the name of the game.
Making the rules and choosing indicator is up to the trader's objective and risk profile.
So, to summarize all the steps or answers to all 5 questions [ can be more than 5 ], are as follows :-
1. Work with an indicator which is back tested [ at 70 % success rate ]
2. To be clear, which time-frame to trade with [ depends on the trader's objective and risk profile ].
3. Follow the rule book.
Making the Rule book [ 50 % of the trading system ] and following the rule book [ balance 50 % of the trading system success ] is the rule of the game.
4 Likes
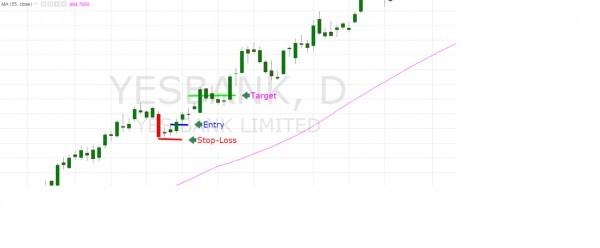
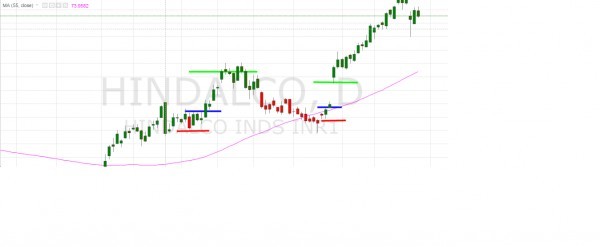
SIMPLE PULLBACK STRATEGY ( 1 RISK=2 REWARD )
PINK line is 55 SMA... RED candle is CLOSE below 15 EMA... GREEN candle is CLOSE above 15 EMA. (For Above 70% accuraccy...( 1 RISK=1 REWARD ) )....
Condition for BUY : Price above 55 SMA...Green candle after Red candle (refer: Green/Red candle rule) ...Buy above high of Green candle..Stoploss below TWO candle's Low......Exit 2 Reward.
For SELL : Vise versa of Buy condition.
4 Likes
My trading strategy is very simple and easy to understand, how simple is your strategy your success rate will be good.
We trade to make money but as a same time it’s a very expansive hobby. trade to make money.
My strategy is trade price action price action is a real time indicator of trader’s behavior and physiology. and i trade only when market allow me to trade, i don’t fight with market, and i don’t allow my ego to control my trade,
In my trading strategy i use only one indicator with candle sticks that’s all.
In my trading strategy stop loss is define by my price patten of candle sticks, and my targets are 2 or 3 times of my SL.
I don’t interpret my trade in between, it have to hit any one of my orders sl or trgt.
My trading strategy is lose small gain big that’s all period.
I use Price patten of candle sticks with Bollinger band with default settings,
I analyze on daily chart and trade on 15 min chart, because it’s not a blind game.
This is give me 60:40 wining odds. in this your are a winner if you take 40:60 also.
1 Like