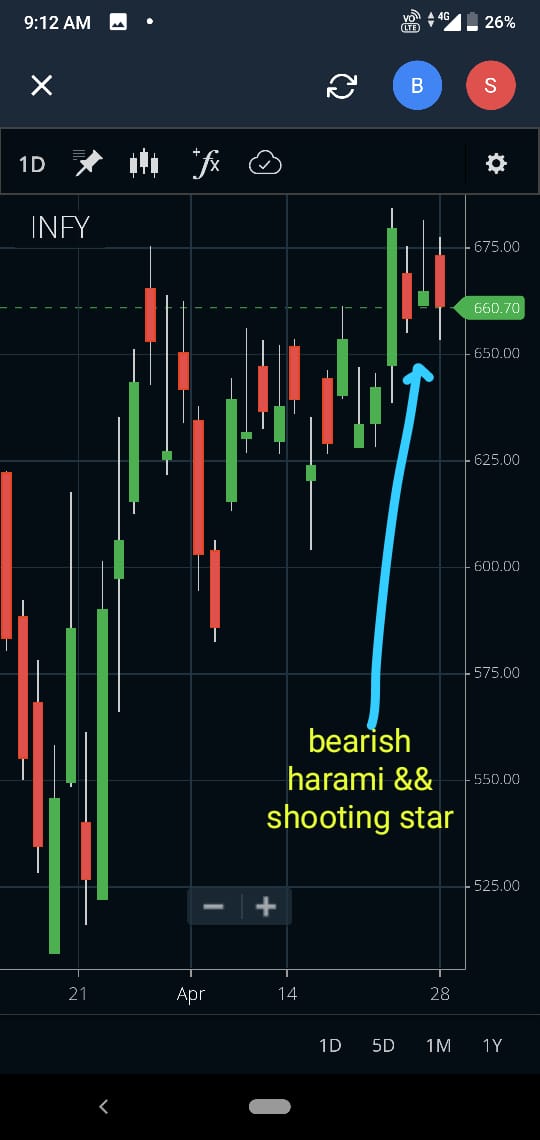
Hello, Today morning I identified a candlestick pattern comprised of 2 candlesticks.
I learned from Zerodha/Varsity that Bearish Harami (following an uptrend) and shooting star right after that Indicates a downtrend.
Based on which I shorted my positions. But this analysis went wrong.
Can Anybody help me understand this much better what went wrong, So I can take positions better in future.
Thanks
@divyesh only candlestick pattern chart is not enough to take trades , you need to add some indicators to fully analysis the instrument to take trades…
As in there will be some false signals generated ,
There is no 100% results with technical analysis !
@Mehdi_Abbas thanks for the guidance,
I jumped to take trade as I see 2 bearish convincing patterns generated. That make me to take a trade without looking something else.
I think i should look out for indicators
Thanks
The body of the shooting star should form at the top of the previous bullish candle and the open of the bearish candle should also be near the body of the shooting star.
Okay, So Shooting star is not here relevant.
But what if I took decision just based on the Bearish harami pattern on that very day end ? As it is perfect match I guess !
The bearish candle shows the strength of sellers. In this case the sellers are not that strong because they didn’t even succeeded to break the close of the bearish candle which was formed before this shooting star. (You also have to consider the price behaviour of past 2-3 days along with volume also to reach a conclusion. You can not take a trade just on the basis of one day’s candle ).
P.S. You have not added the ‘volume’ indicator beneath your chart. Add that too.