Hey there.
I am new in trading.
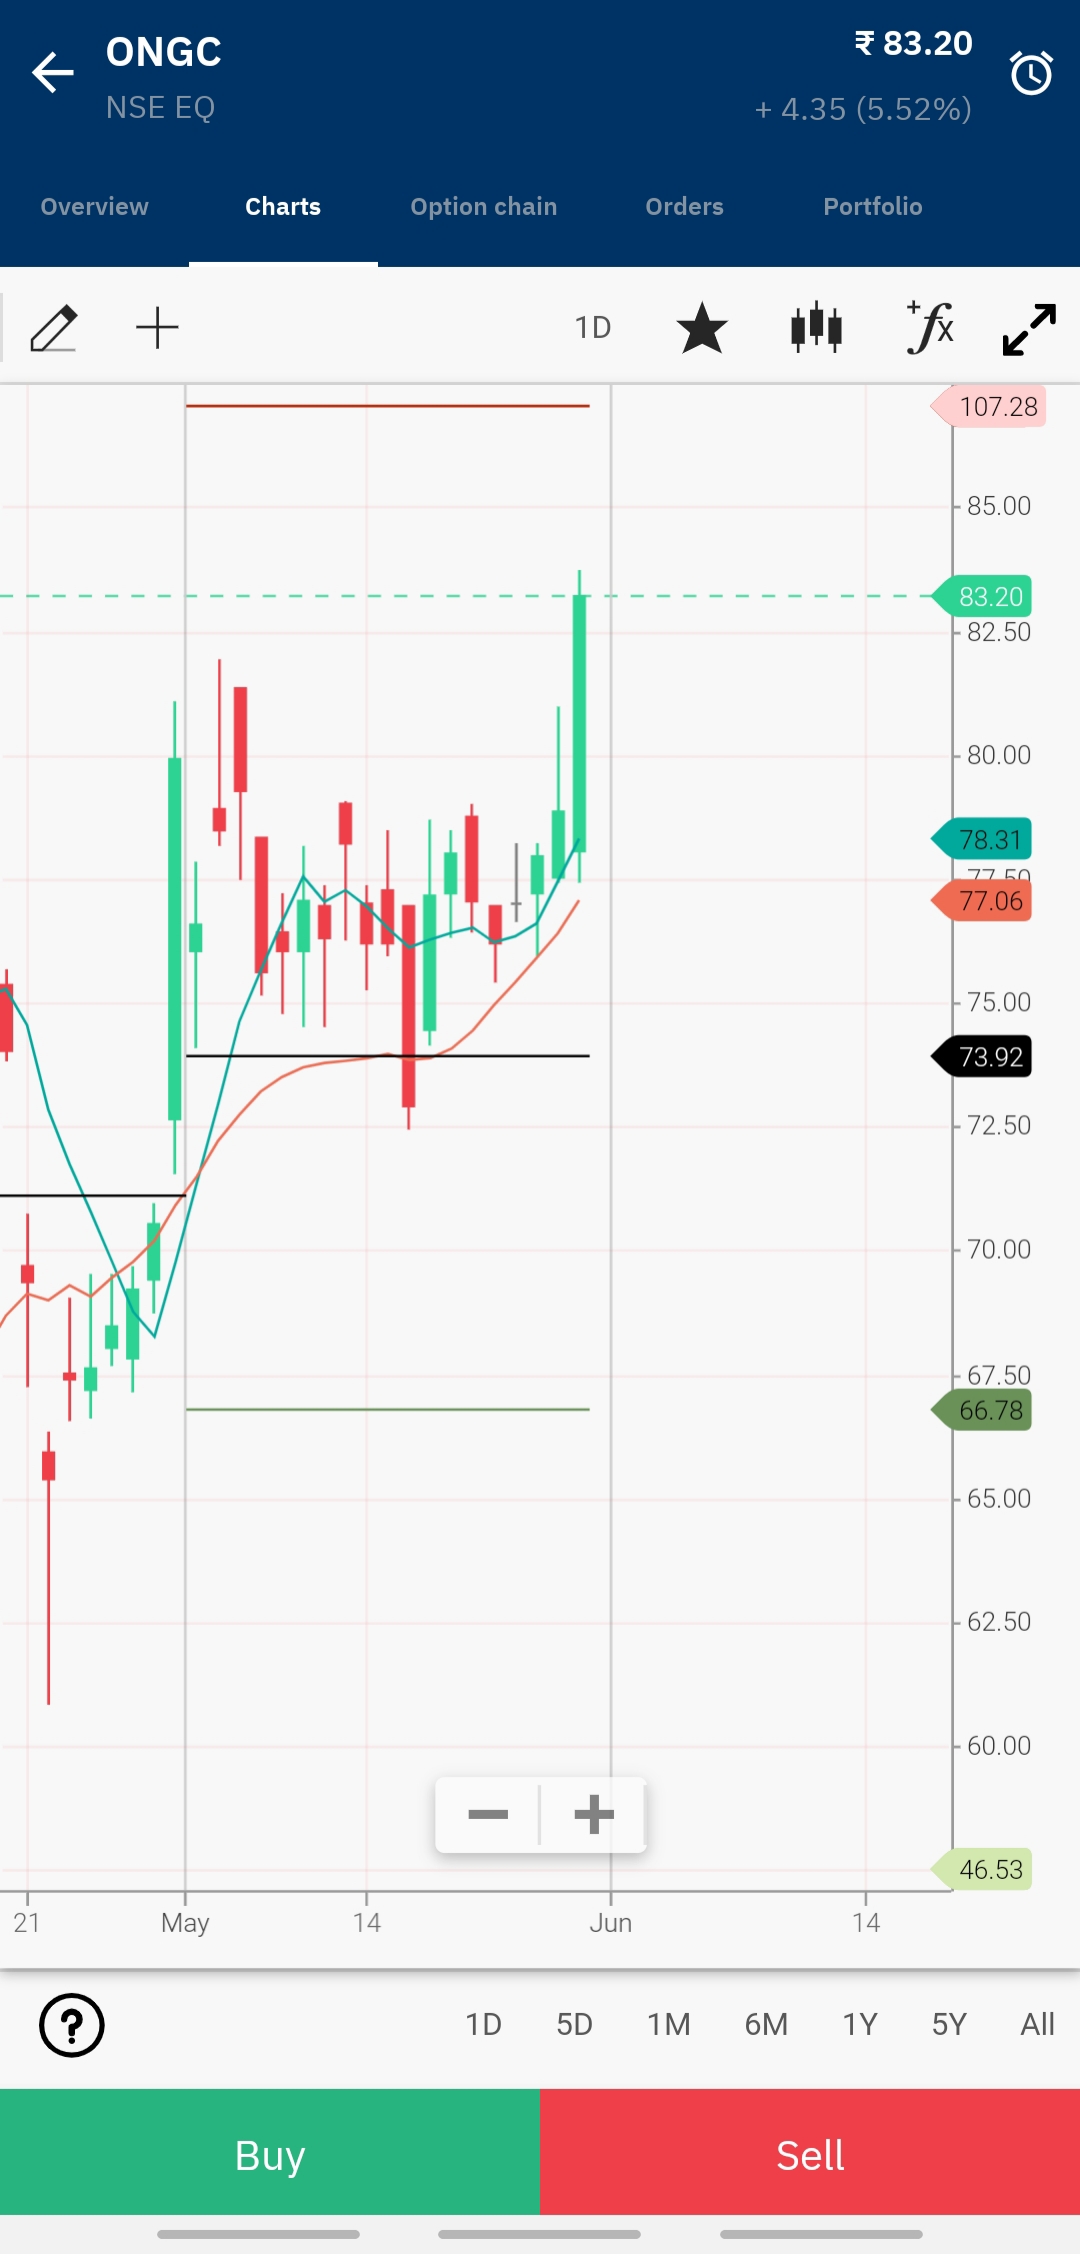
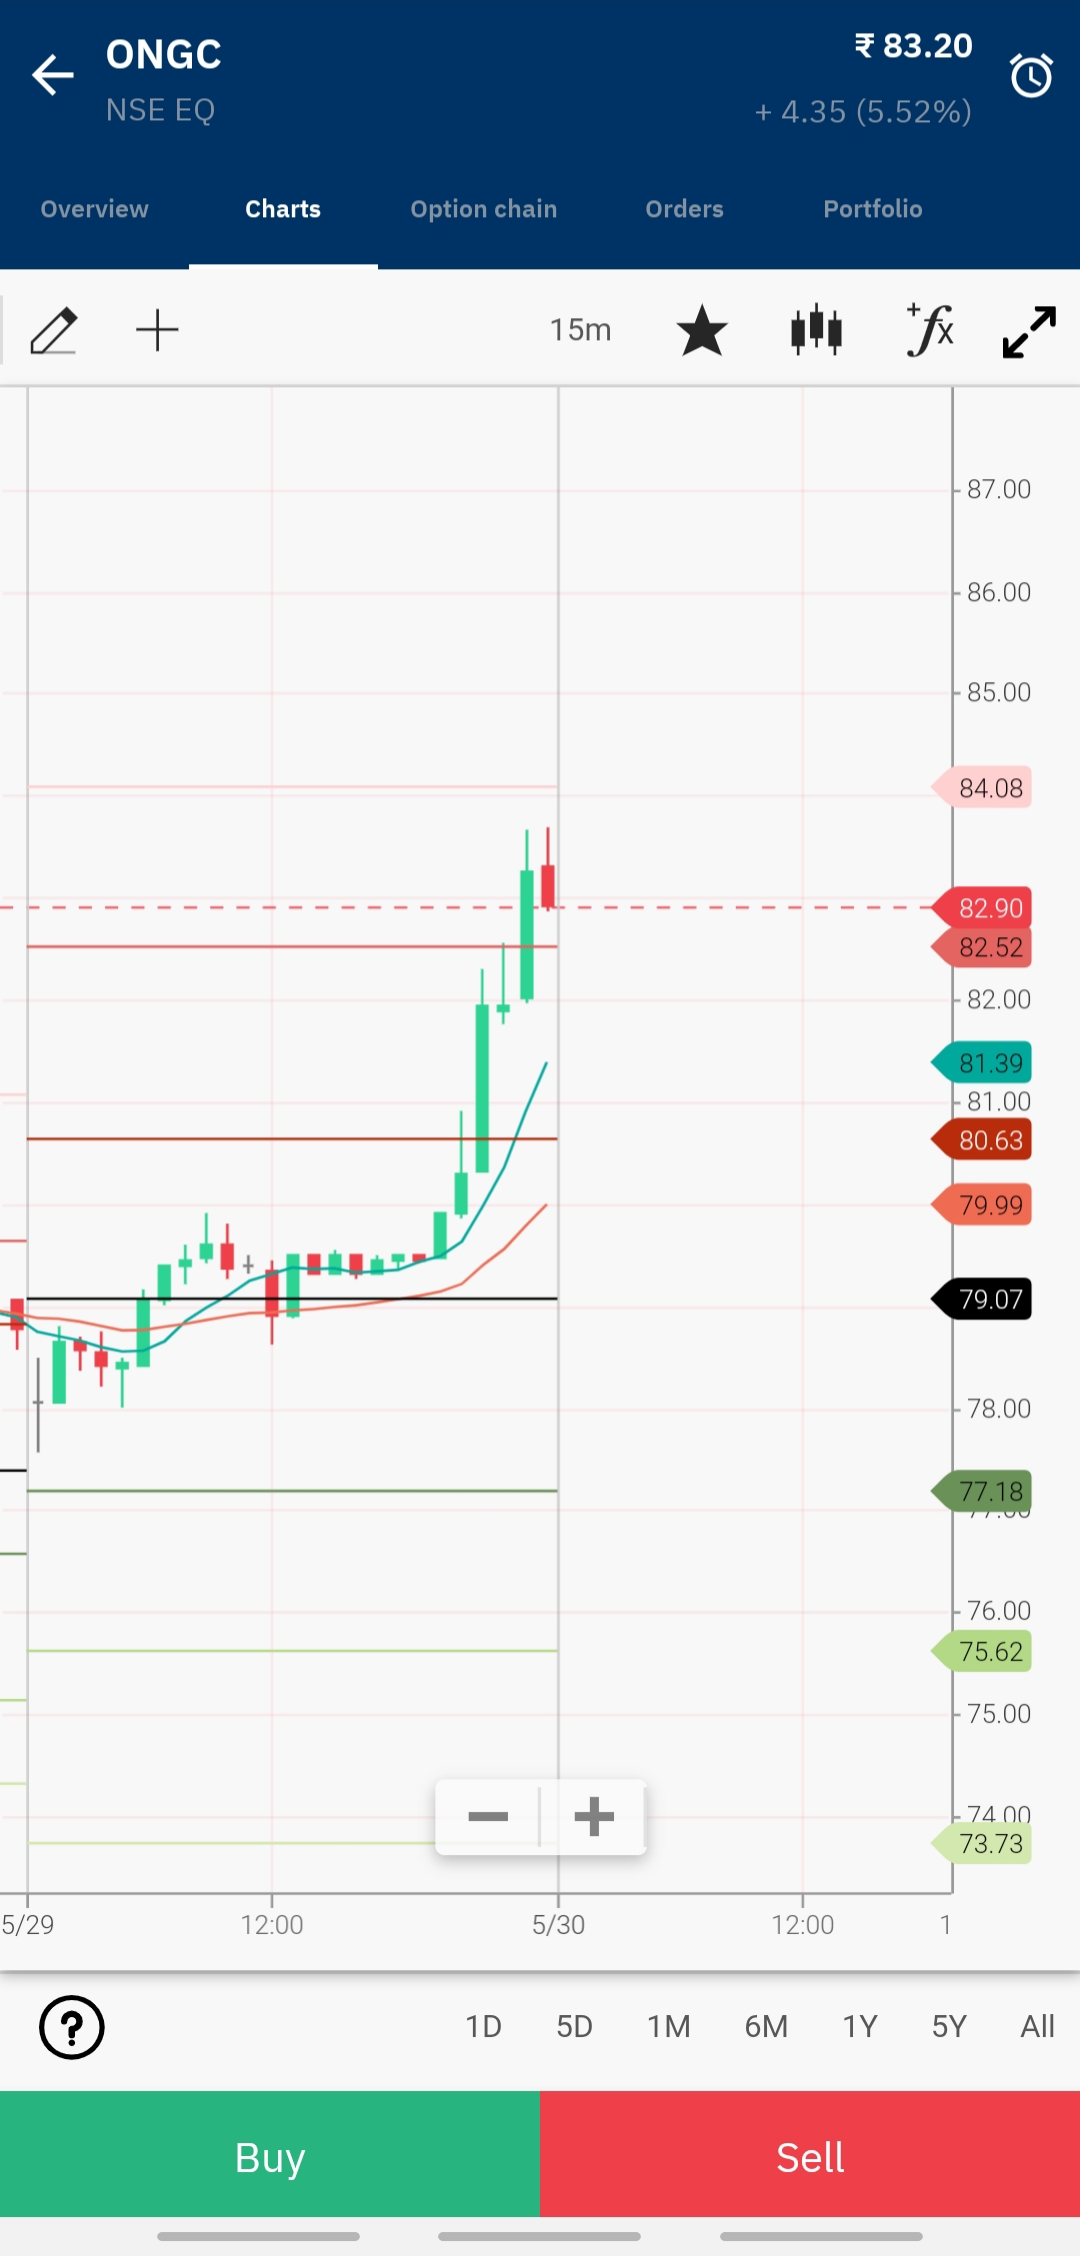
I was going through ONGC stock and I found that, when I use 1 Day chart, it shows current price of stock and when I use 15 min chart, it shows different than current price.
Please see the price near candle.
I have attached pic below.
Please help.
The daily closing price of a stock is determined by using weighted average price of last 30 minutes, that’s why closing price on 15 minutes charts is different than daily chart.
Thank you for replying.
Now my confusion is, whether we should take 15 min price or 1 Day price to plan next day trade.
Thanks.
There isn’t much difference between the two, so choose whatever you want.
I may not have been clear with my answer in morning, to understand more refer to this post Why are the OHLC values on daily and hourly charts different?
Thanks for the link