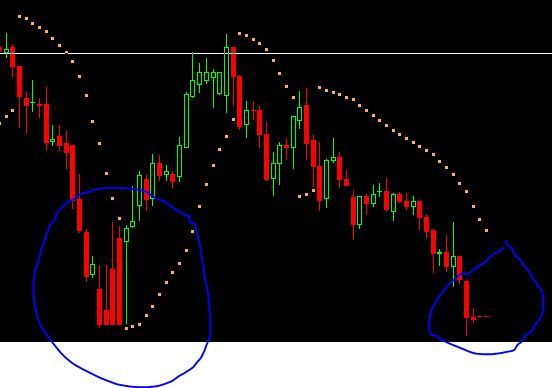
please help me to solve this,,,when i backfill data from nest to ami (csv) some strange candles are formed in AMI but in PI and NEST charts are normal and same,,,i asked this same issue in Q&A ,but no response...experts can help me,,please
please help me to solve this,,,when i backfill data from nest to ami (csv) some strange candles are formed in AMI but in PI and NEST charts are normal and same,,,i asked this same issue in Q&A ,but no response...experts can help me,,please
Backfilling from nest to excel and to Amibroker will not be accurate everytime, it depends on various factors, you can take data from any data provider.
can you suggest me some good and cheap data providers