China’s Real Estate Market has erased all gains from the last 20 years 
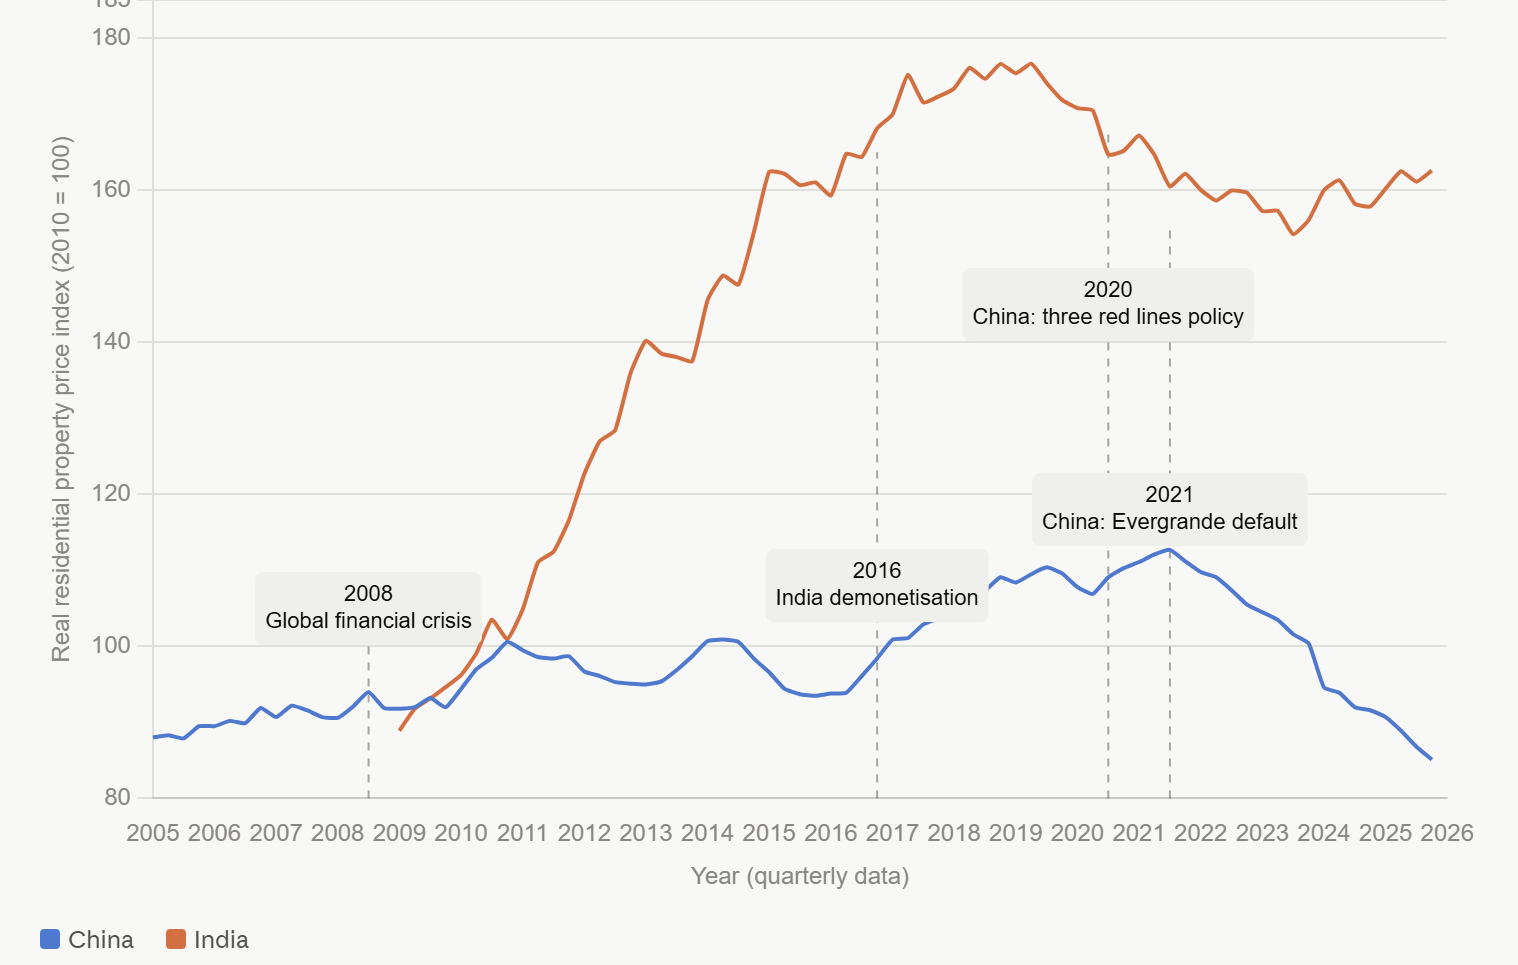
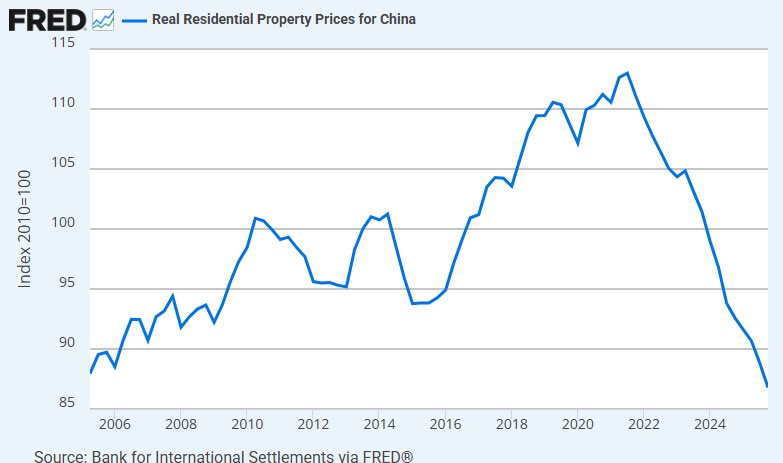
Bank for International Settlements (BIS) data show that China’s real residential property prices (inflation-adjusted) back near 2006 levels after peaking in 2021, fully erasing 20 years of gains amid a prolonged sector slump.
The FRED chart depicts prices rising from ~88 in 2006 to over 112 by 2021 before falling sharply to ~86, reflecting overbuilding, weak demand, and policy shifts impacting one of China’s key economic pillars.
Roughly $18–20 trillion USD in perceived household wealth has been erased from China’s residential property sector since the 2021 peak. For comparison, China’s 2025 GDP is $19.6 trillion.