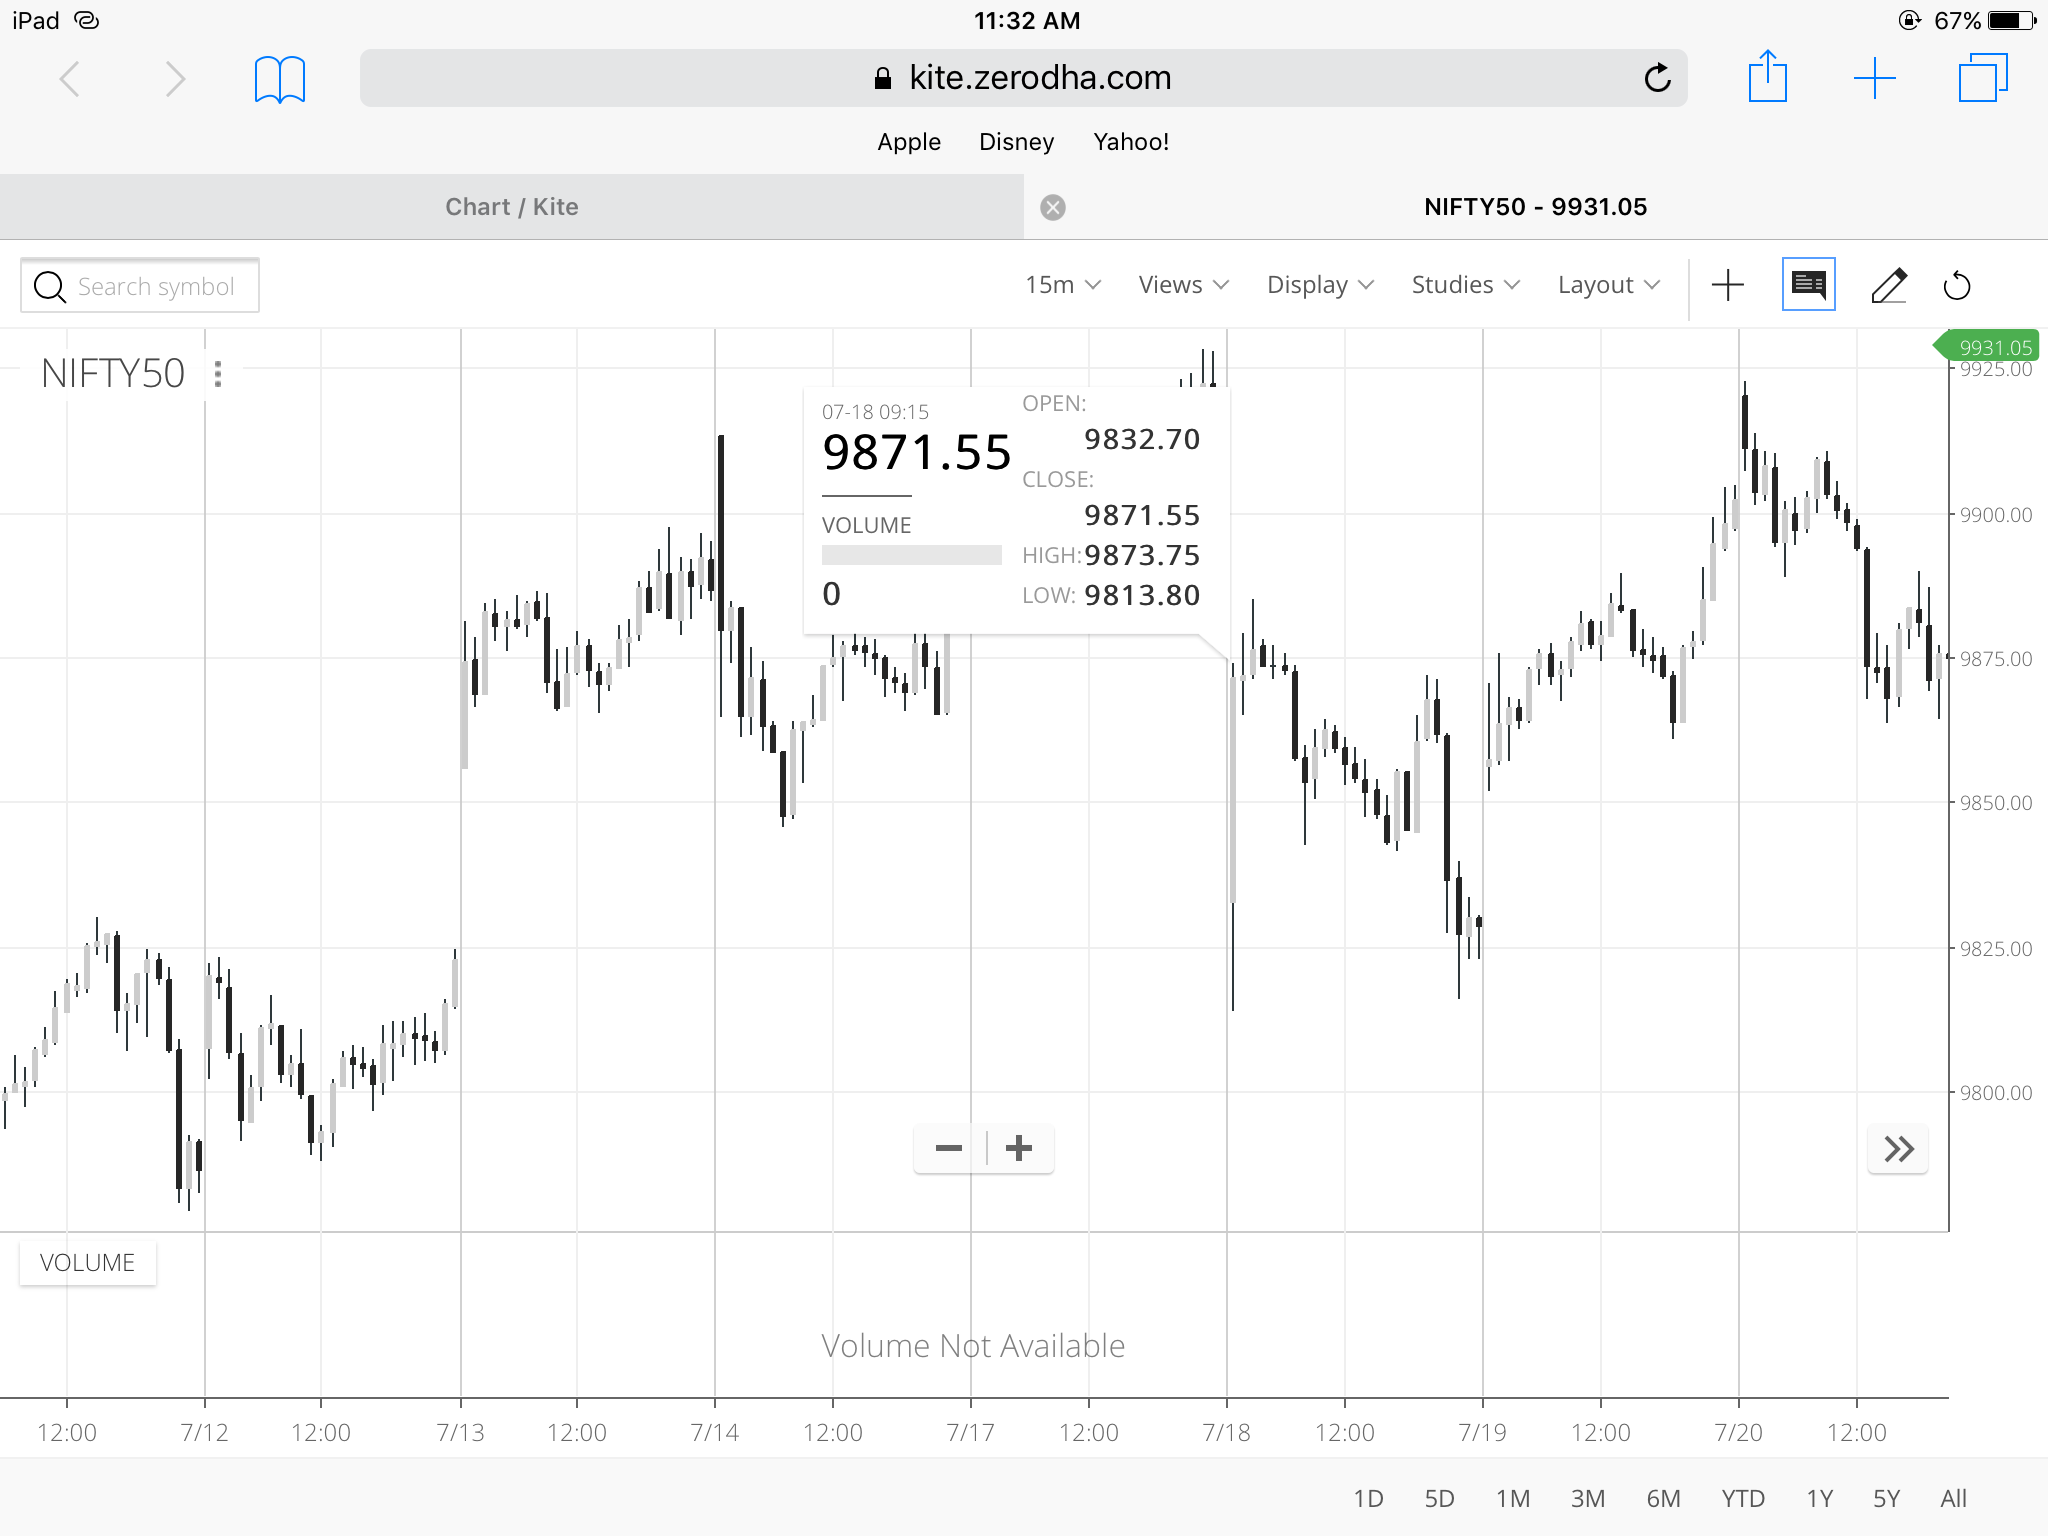
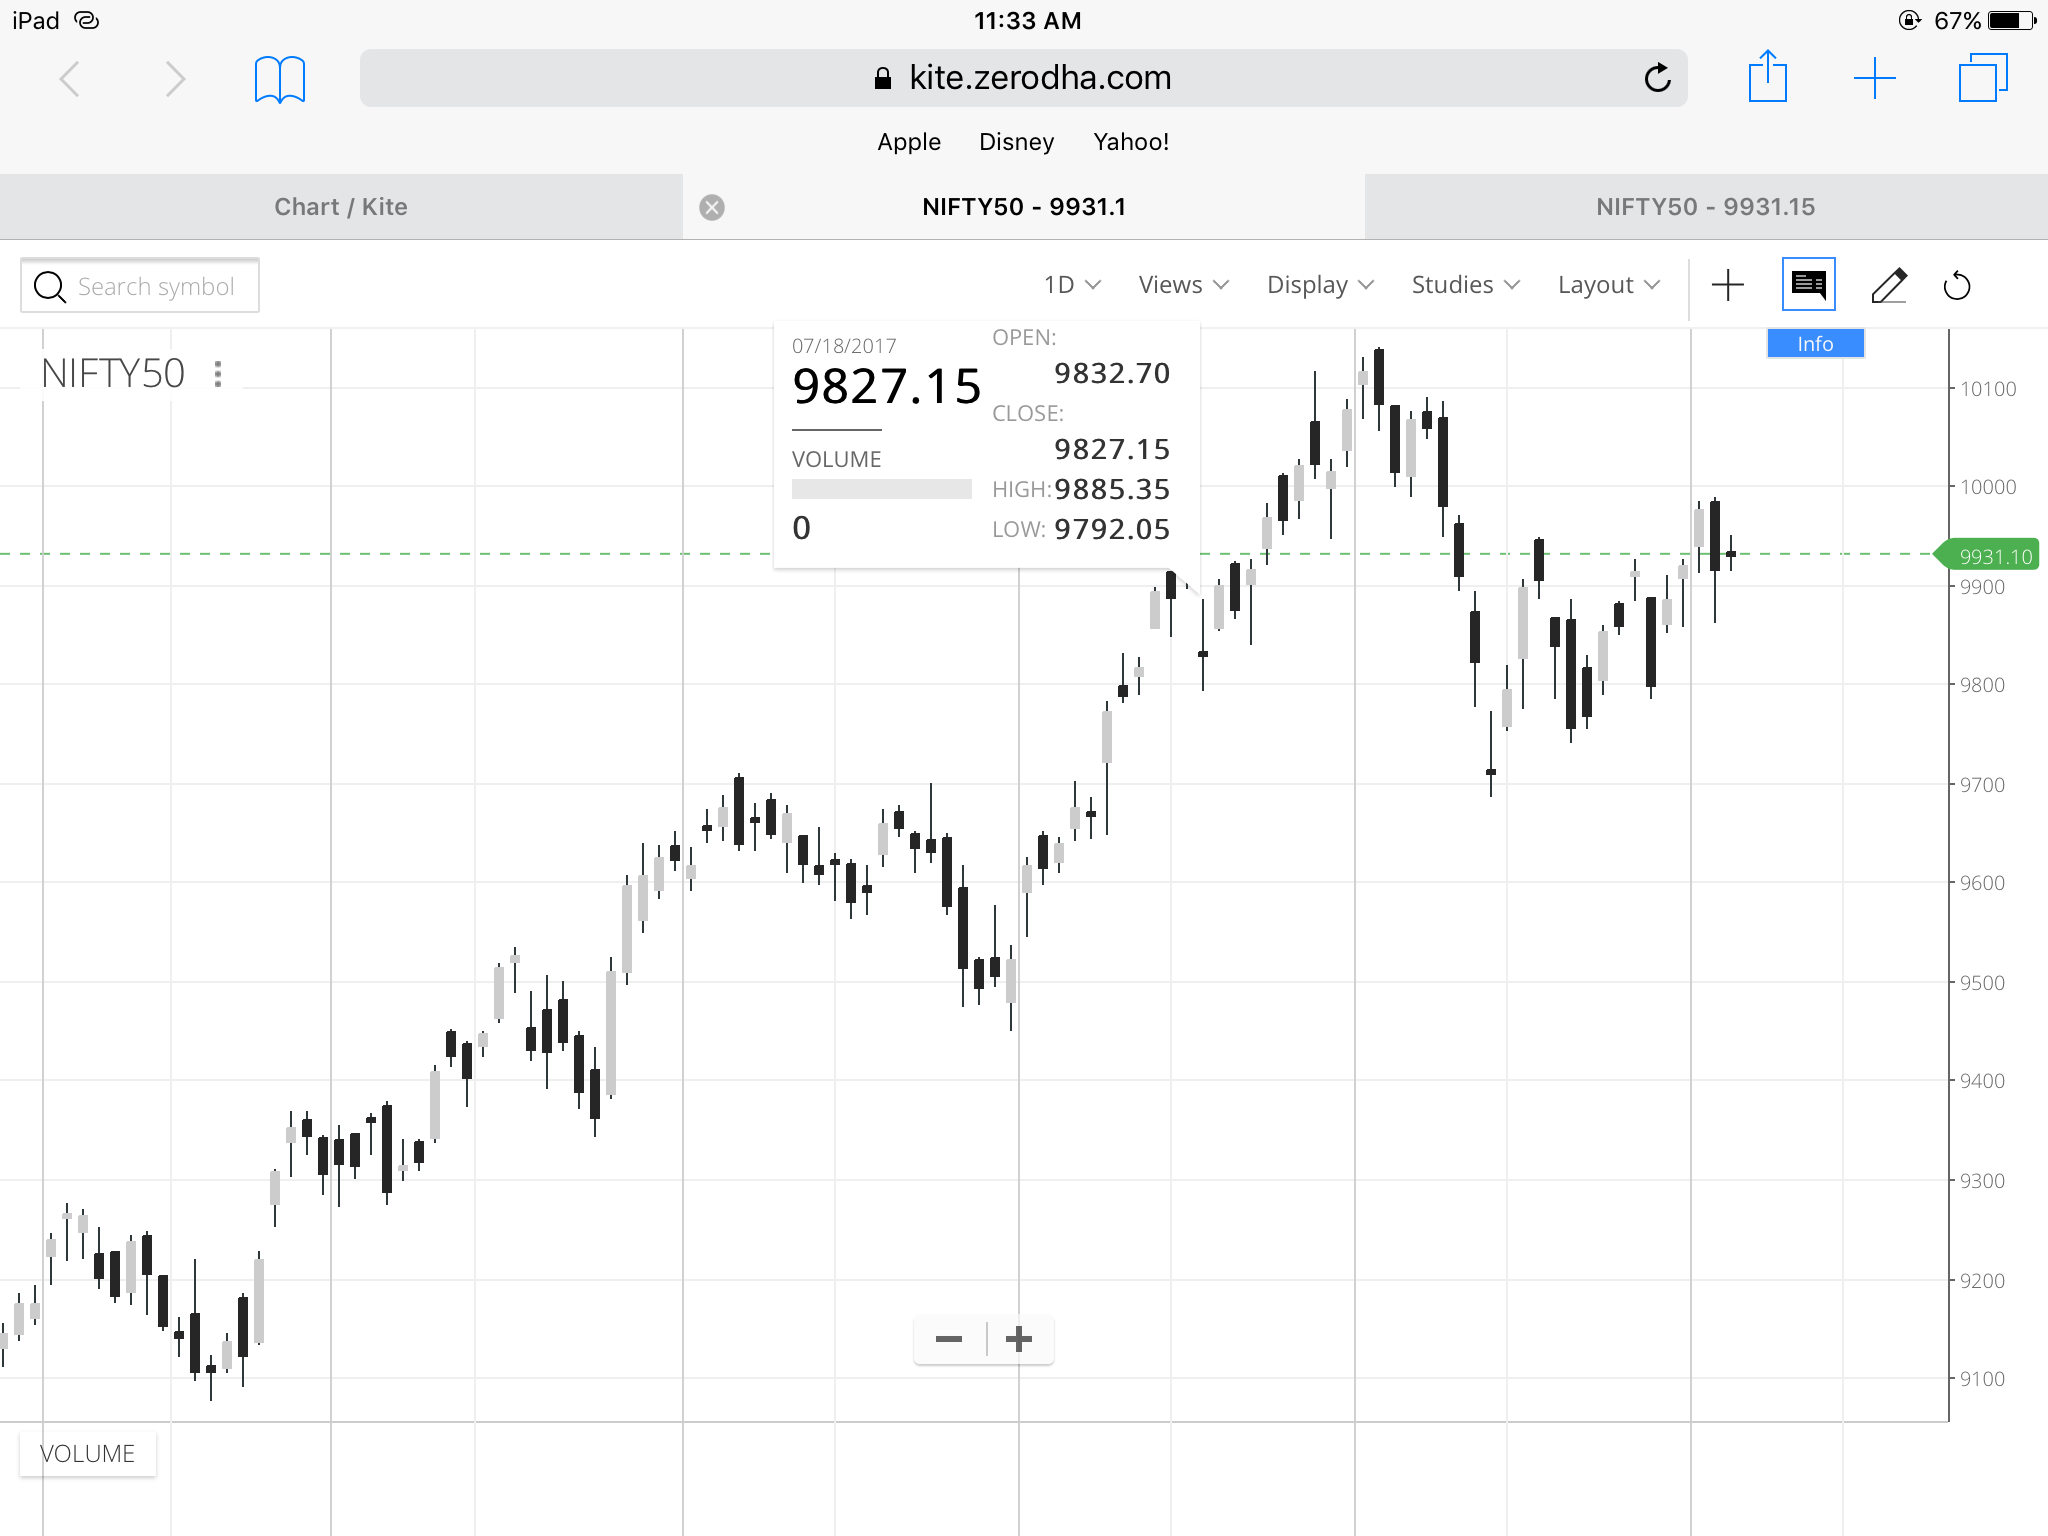
on July 18 2017 the day data and intraday data vary by a wide amount. the low on the day data is around 9792.05 but on the intraday its 9813.80 ,am i seeing something wrong or what is this?
Suggest you to first read this answer of mine:
Intraday candles are formed by ticks that we receive from the exchange. There could be hundreds of ticks in a second, but we get between 2 to 4 ticks from the exchange. So there might be price points that we never captured.
But exchange at end of day give out OHLC for the day on bhav copy - what happened at the exchange. We sync the daily chart with this OHLC. We can’t do this for intraday, because exchange gives out only OHLC for day and not per min. Hence, there can be ticks which the intraday chart didn’t capture which will show up on day chart. Usually if there is a big difference, it might be some stray ticks at market open or when liquidity is extremely less.