920 short straddle is a common and most simplified option selling Strategy that has been widely used by many intraday traders. The rules of this intraday strategy is
Short ATM Call and Put at 9:20 am with a fixed stop loss say 25%, 35% etc. When stop loss of any of the leg is hit, exit it and continue to hold the other leg till eod. This strategy makes money as long as market moves in one sided direction, since the other leg makes money when the decay happens.
This strategy has become widely popular after the rise of many no code platforms which makes the backtesting easier. Without any coding or intraday data, people just run different combinations and ended up trading different varieties of 920 straddle strategy. But the last few months volatility in the markets has affected lot of such strategies.
Here’s a detailed analysis of 920 Straddle with 25% SL. This analysis would show which days are max profitable, how it behaves on gap days and how it behaves on different VIX days.
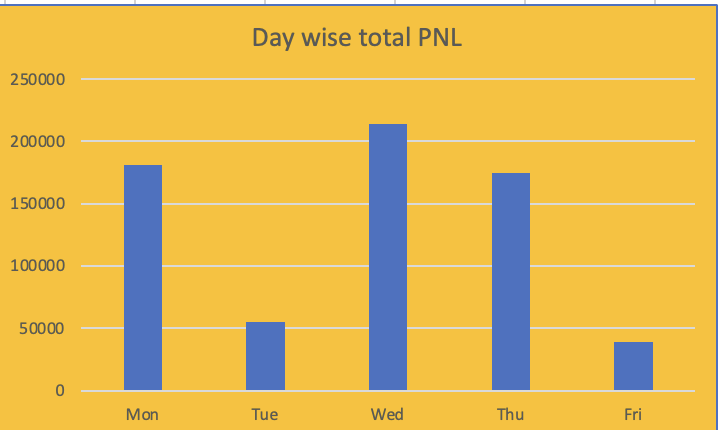
Here’s day wise total profits, Wednesday are the days it has generated highest profits compared to all other days and Friday being the least profitable day.
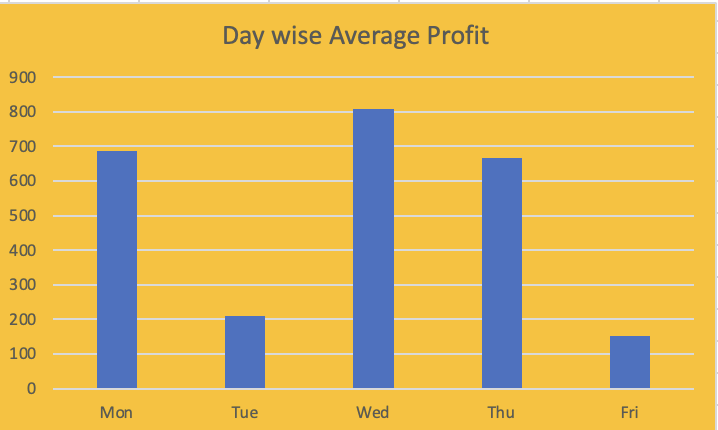
Here’s day wise average profits, obviously Wednesday are the days it has generated highest average profits compared to all other days and Friday being the least profitable day.
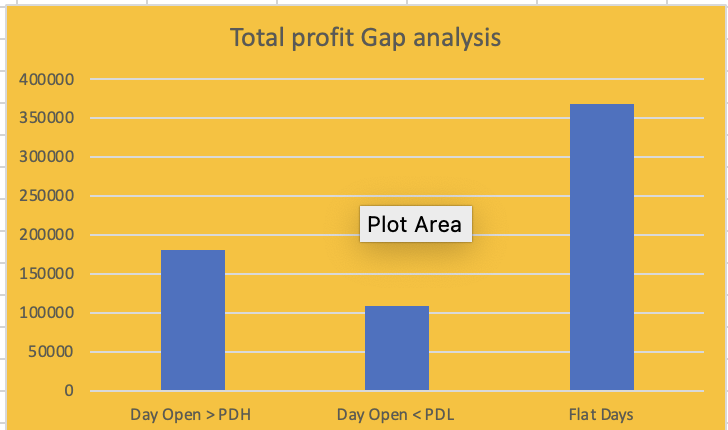
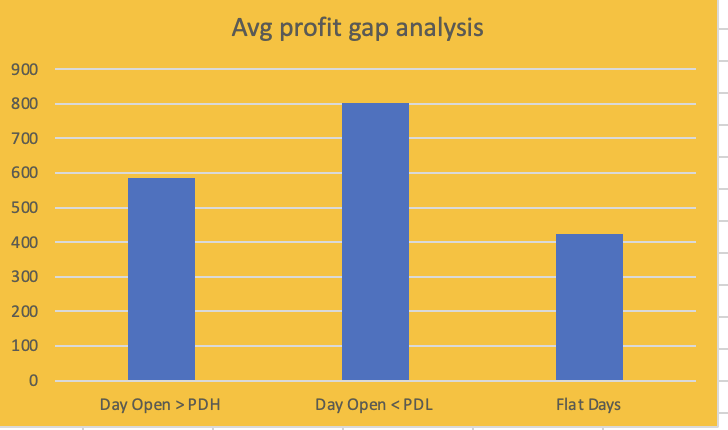
Here’s total profits made during gaps, when day open is greater than previous day high, Day open < Prev day low and flat days. Irrespective of gaps, its able to generate profits over all. Even the avg profits denotes the same
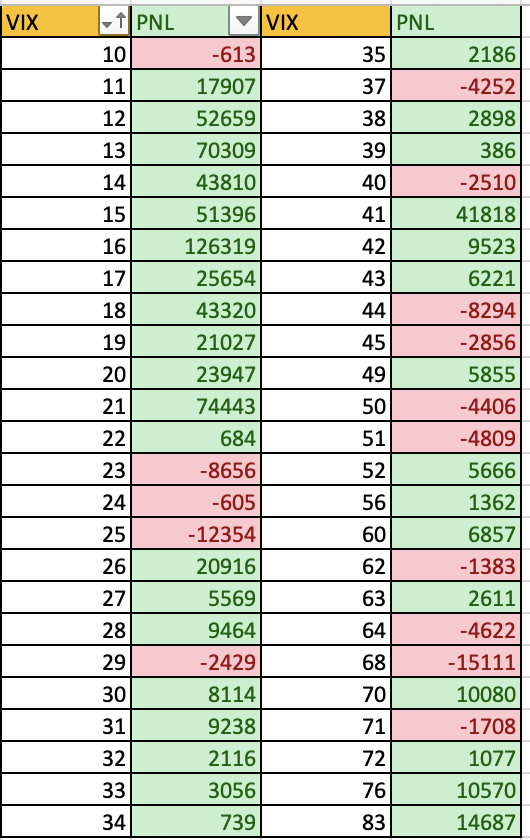
Here’s the VIX analysis with respect to 920 straddle over all profits. There is a large misconception that high vix would end up in loss, but the results shows that even in High Vix 920 straddle made money.
One important thing to note with 920 straddle is most of its profits will come from few trades. out of 1300 trades in last 5 years, If I remove top 10% of the trades, that is if I remove 130 trades, then the overall results turns negative.
But that’s how a typical breakout system works, returns are always non linear. You can’t expect steady returns from such strategies, there will always be periods of prolonged drawdown. But that’s when people thrown in the towel thinking the strategy doesn’t work anymore. People who used OTM hedge for margin benefit for such strategies would have suffered more, since their drawdown would have been much higher. The one who sails through such rough phase with less damage eventually reap the benefits and that’s possible only with robust risk management and money management rules.
Premium of ATM options varies based on each day, the below table shows what’s the average ATM option premium on day wise, what would be total points if 25% stop loss is hit on any leg, what’s the loss per lot, what’s the loss per lot if both leg stop loss gets hit and what’s the percentage of loss we face with respect to the capital.
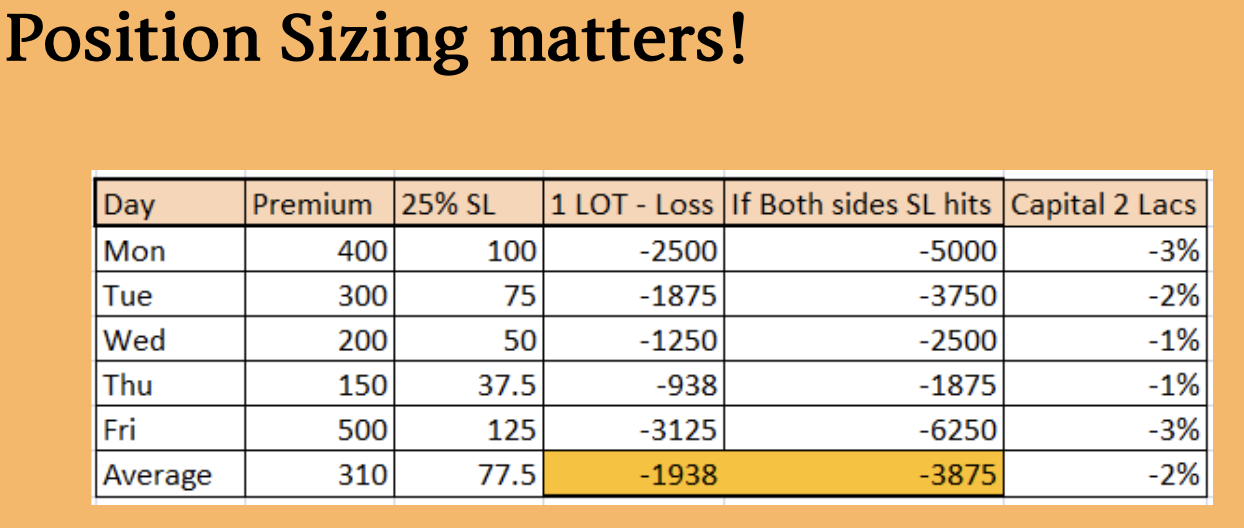
As you can see, a person who is trading same quantity throughout the week would suffer more if his stop loss gets hit often on Fridays, because of higher premium he would loss more. But if he could change his lot size based risk per trade , then he control the drawdown to a certain extent. When a strategy goes out of sync with the markets, it might take few days, few weeks or even few months to come out of drawdown, in such cases trading with right position sizing would do less damage and will make us sail through drawdown phase.