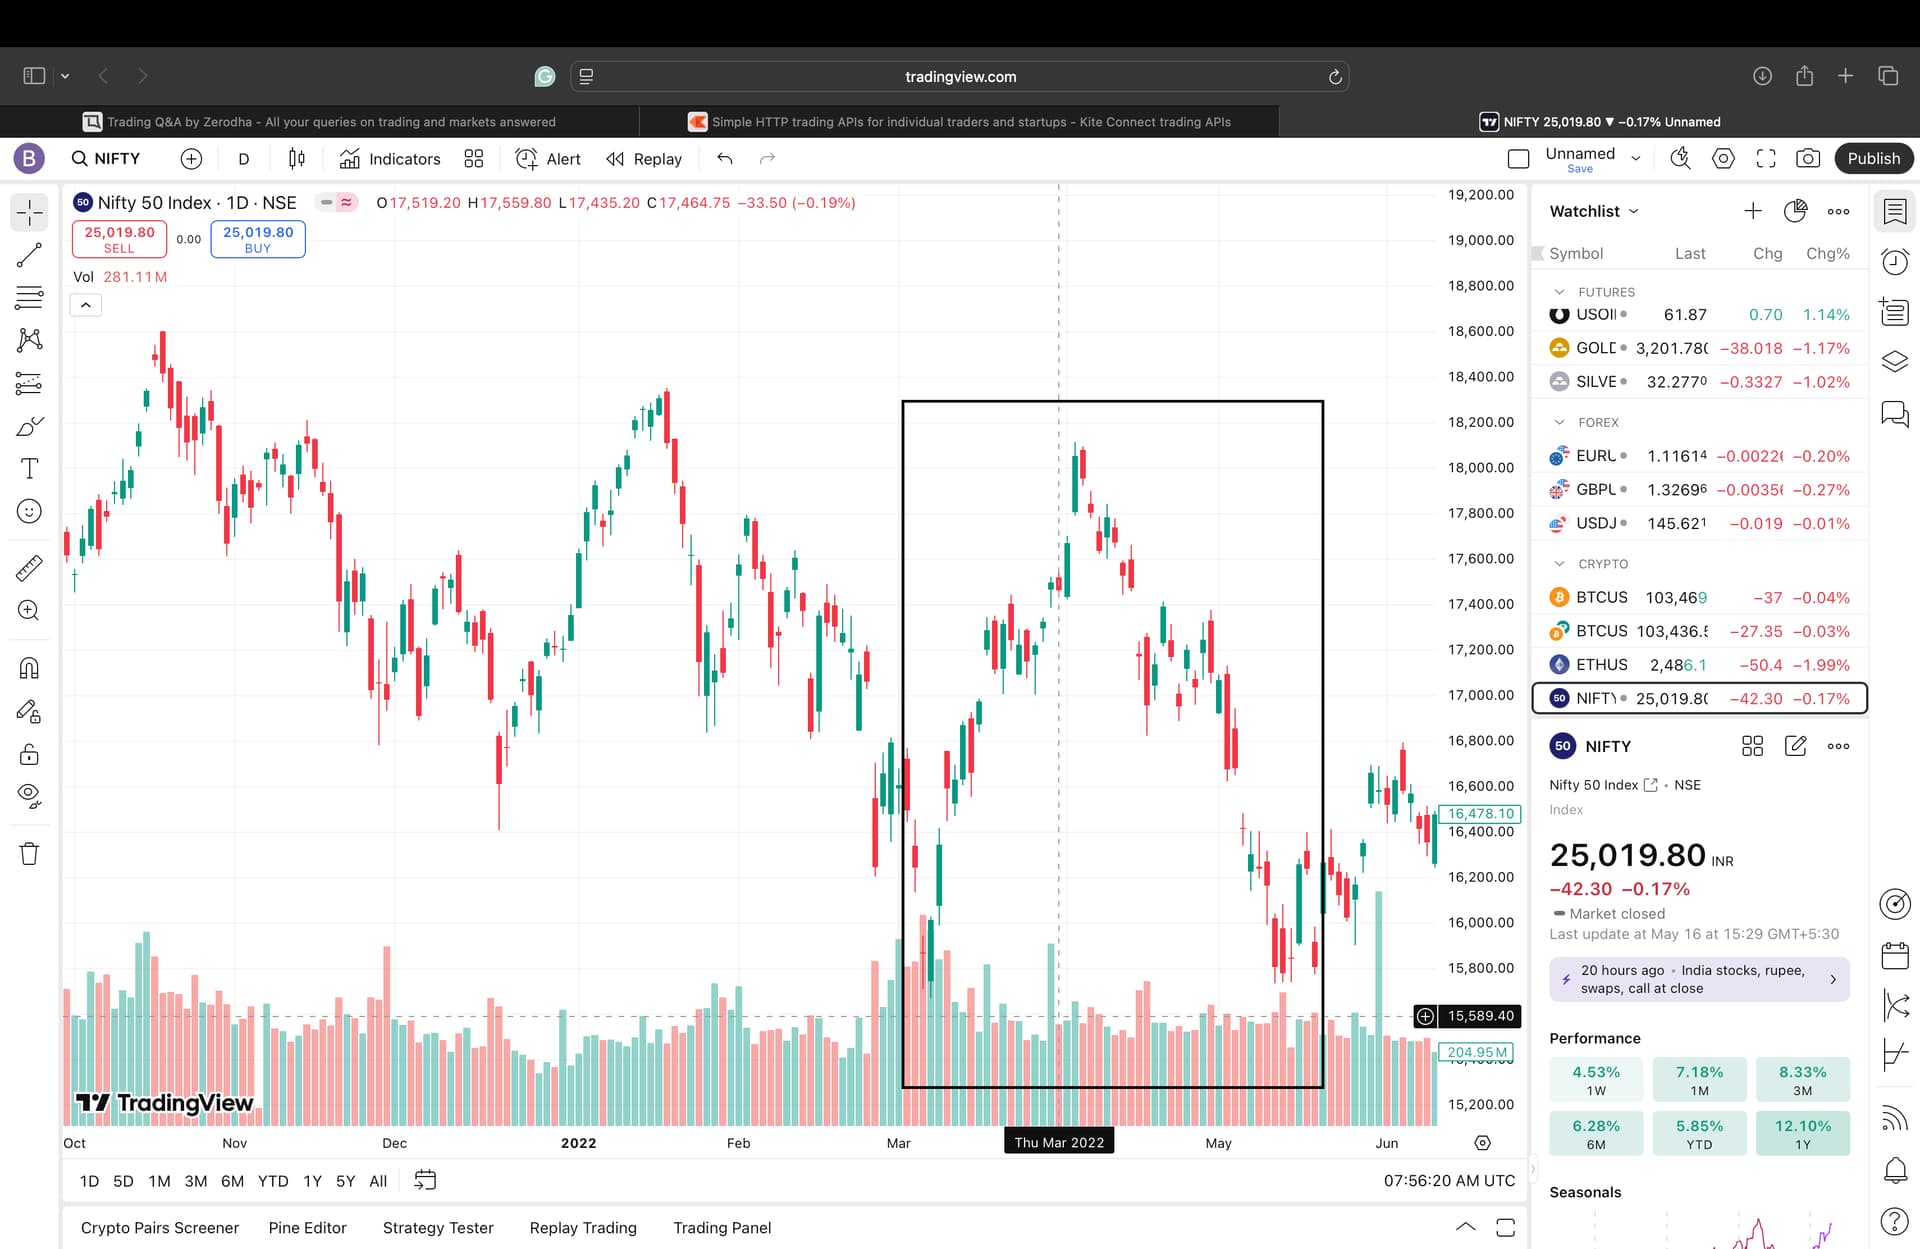
First pic is from 2022 when market crashed after the Russia-Ukraine war, then shot up in a straight line… and came right back to where it started.
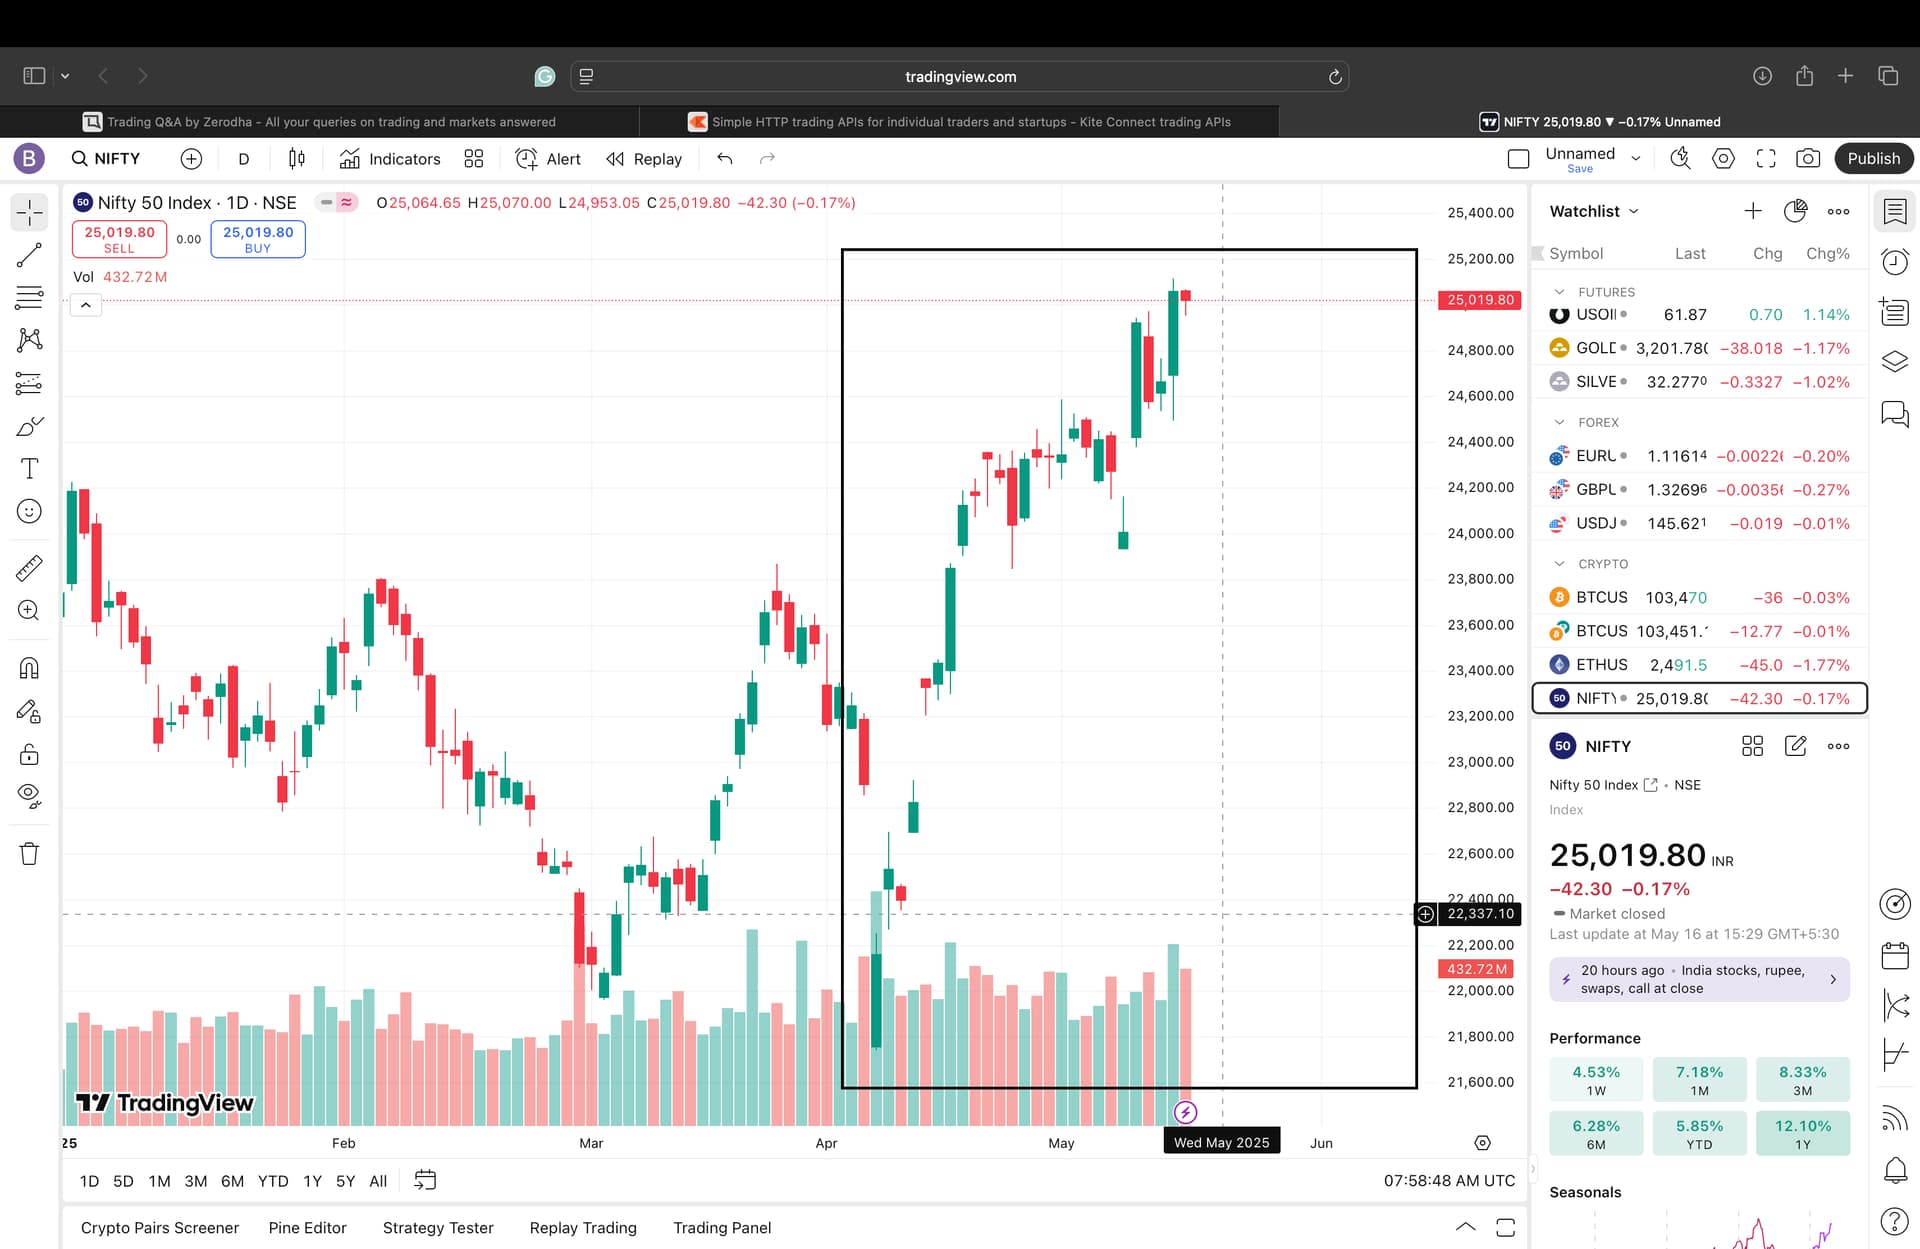
Second one is now, 2025 after the US tariff news. Same thing happened. Small dip, then a crazy bounce back… and again, we’re back at the same level.
Like, this looks way too similar.Same fall. Same recovery. Same spot.
I was just scrolling through charts and randomly noticed it. Felt like I had to share. Anyone else seeing this?
1 Like
dtyxg
May 17, 2025, 8:32am
2
Not viewing it from same perspective but
I am betting NIFTY closing in red this year ; It has been closing + for the past 9 years
Lets see
According to my analysis, Nifty closing for the year will be around 23500.
dtyxg
May 17, 2025, 9:38am
4
Arriving at a number can be overstretched, but as long as it supports my view, it’s good
3 Likes
any market when dips because of un natural sudden events , then it comes back quickly to levels from where it starting to dip.
Source: - Market History.
1 Like
I don’t think anyone can predict it this way. I don’t even know what my next x trades will do.
2 Likes
My point remains + I also agree with @SpacemanSpiff
Agree, market is so close to ATH. It can be acheived any day. Just sharing my observation.