Does an OFS kill the IPO's buzz?

Does an OFS kill the IPO’s Buzz??

Hypothesis: Higher OFS percentage in an issue results in lower subscription rates and does not have a significant direct impact on listing gains/losses.

The Data behind this Analysis

Sample Selection Process
  • Initial Dataset: 79 IPOs from FY24 and FY25
  • Refined Dataset: 69 IPOs (removed 10 outliers with extreme OFS percentages of 0% and 100%)
  • Focus Group: Top IPOs by issue size for visualization (numbers vary per chart)

Findings:

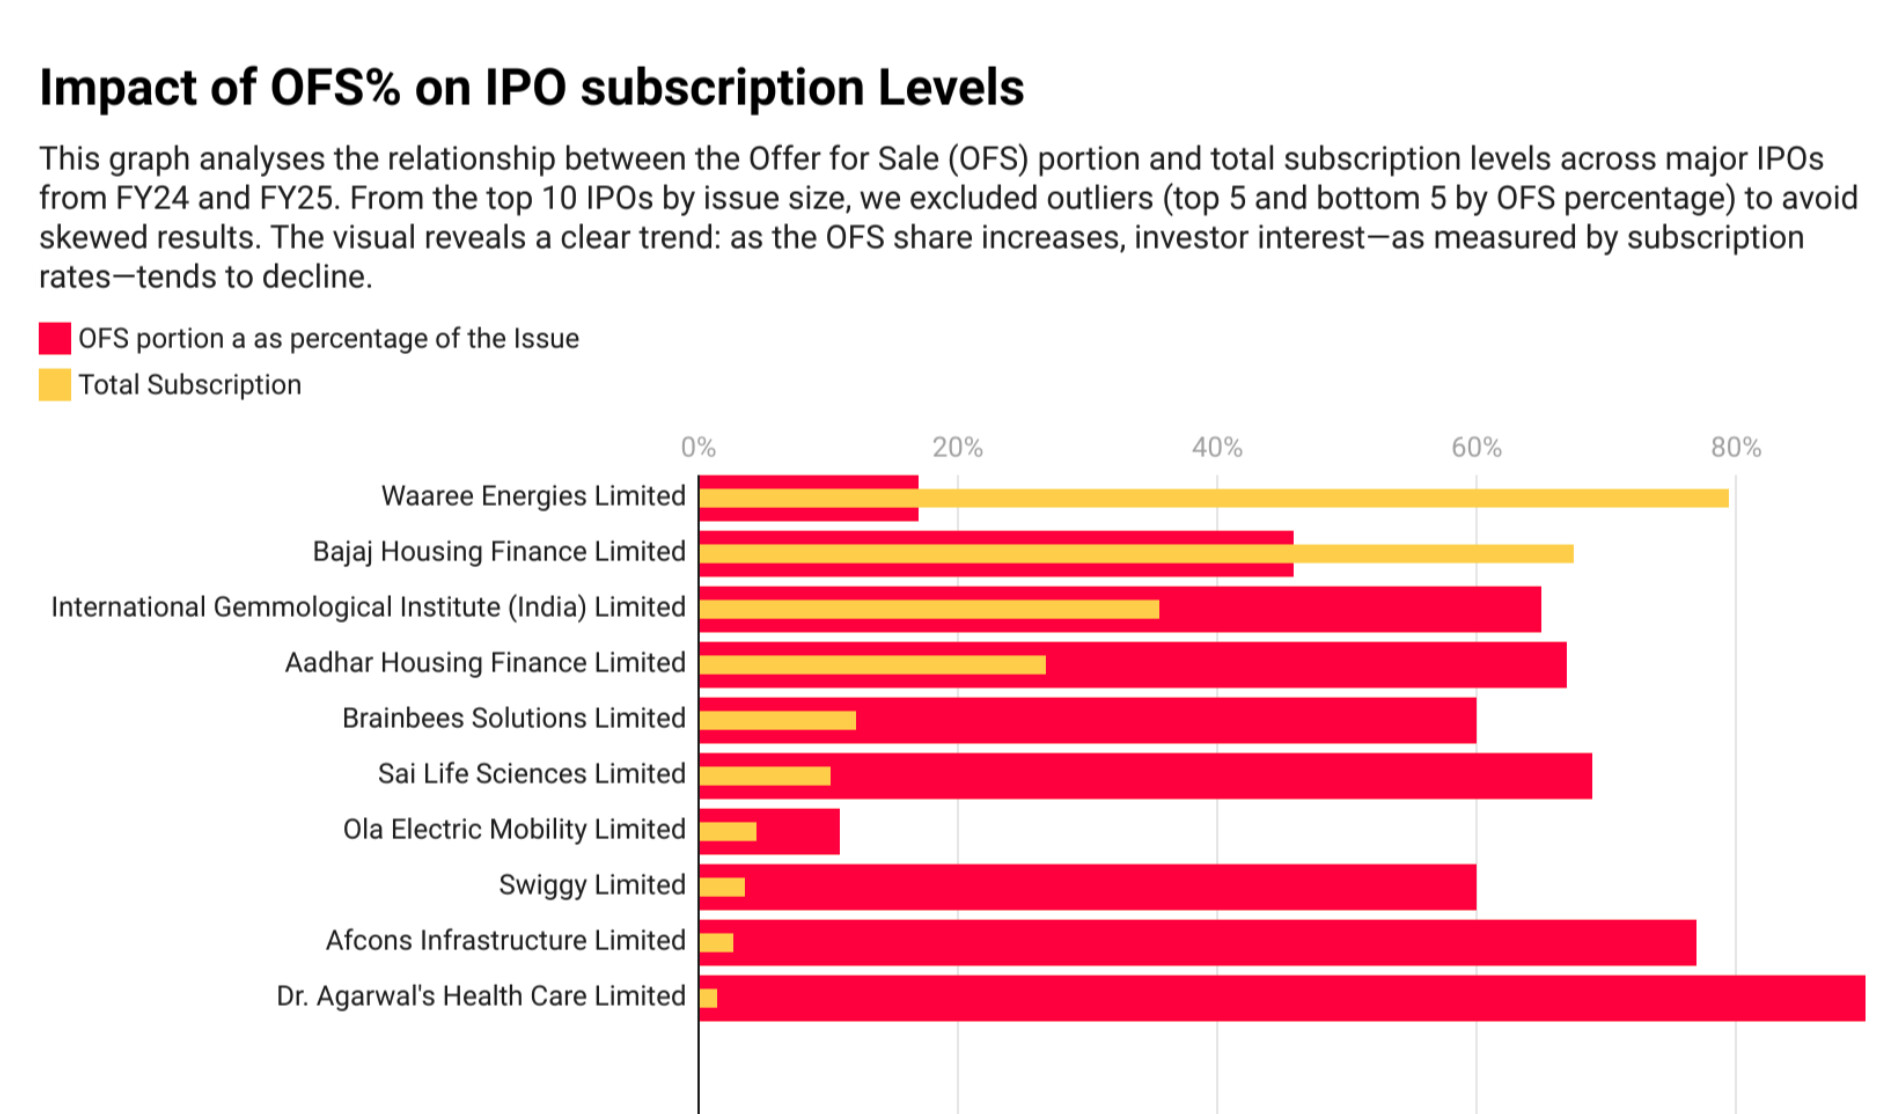
1. OFS% in an issue VS Subscription Rates

Looking at the top 10 IPOs by issue size, there’s a clear pattern: OFS percentage increases, total subscription rates tend to decrease.

Key Insight: The Pearson correlation coefficient of -0.3023 confirms this negative relationship. Link

What does this correlation tell us?

  • -0.30 falls in the moderate negative correlation range (between -0.3 and -0.5)
  • The relationship is moderate and meaningful
  • For every increase in OFS percentage, we can expect subscription rates to decline with moderate confidence.

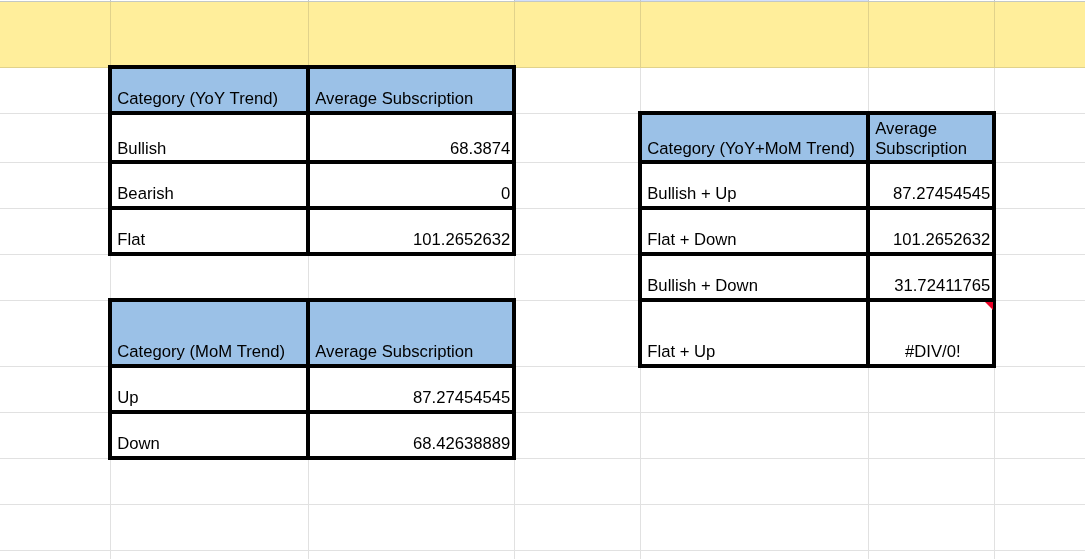
2. Subscription Patterns Across OFS Categories

OFS Category Average Subscription
Pure Fresh (0%) 154.605
Low OFS (1-30%) 87.21125
Medium OFS (31-70%) 56.16785714
High OFS (71-100%) 66.97

What’s interesting here?

  1. Pure fresh issues absolutely dominate with 154x average subscription
  2. Clear decline from Pure Fresh to Low OFS to Medium OFS
  3. Surprising uptick in High OFS category - this suggests other factors at play

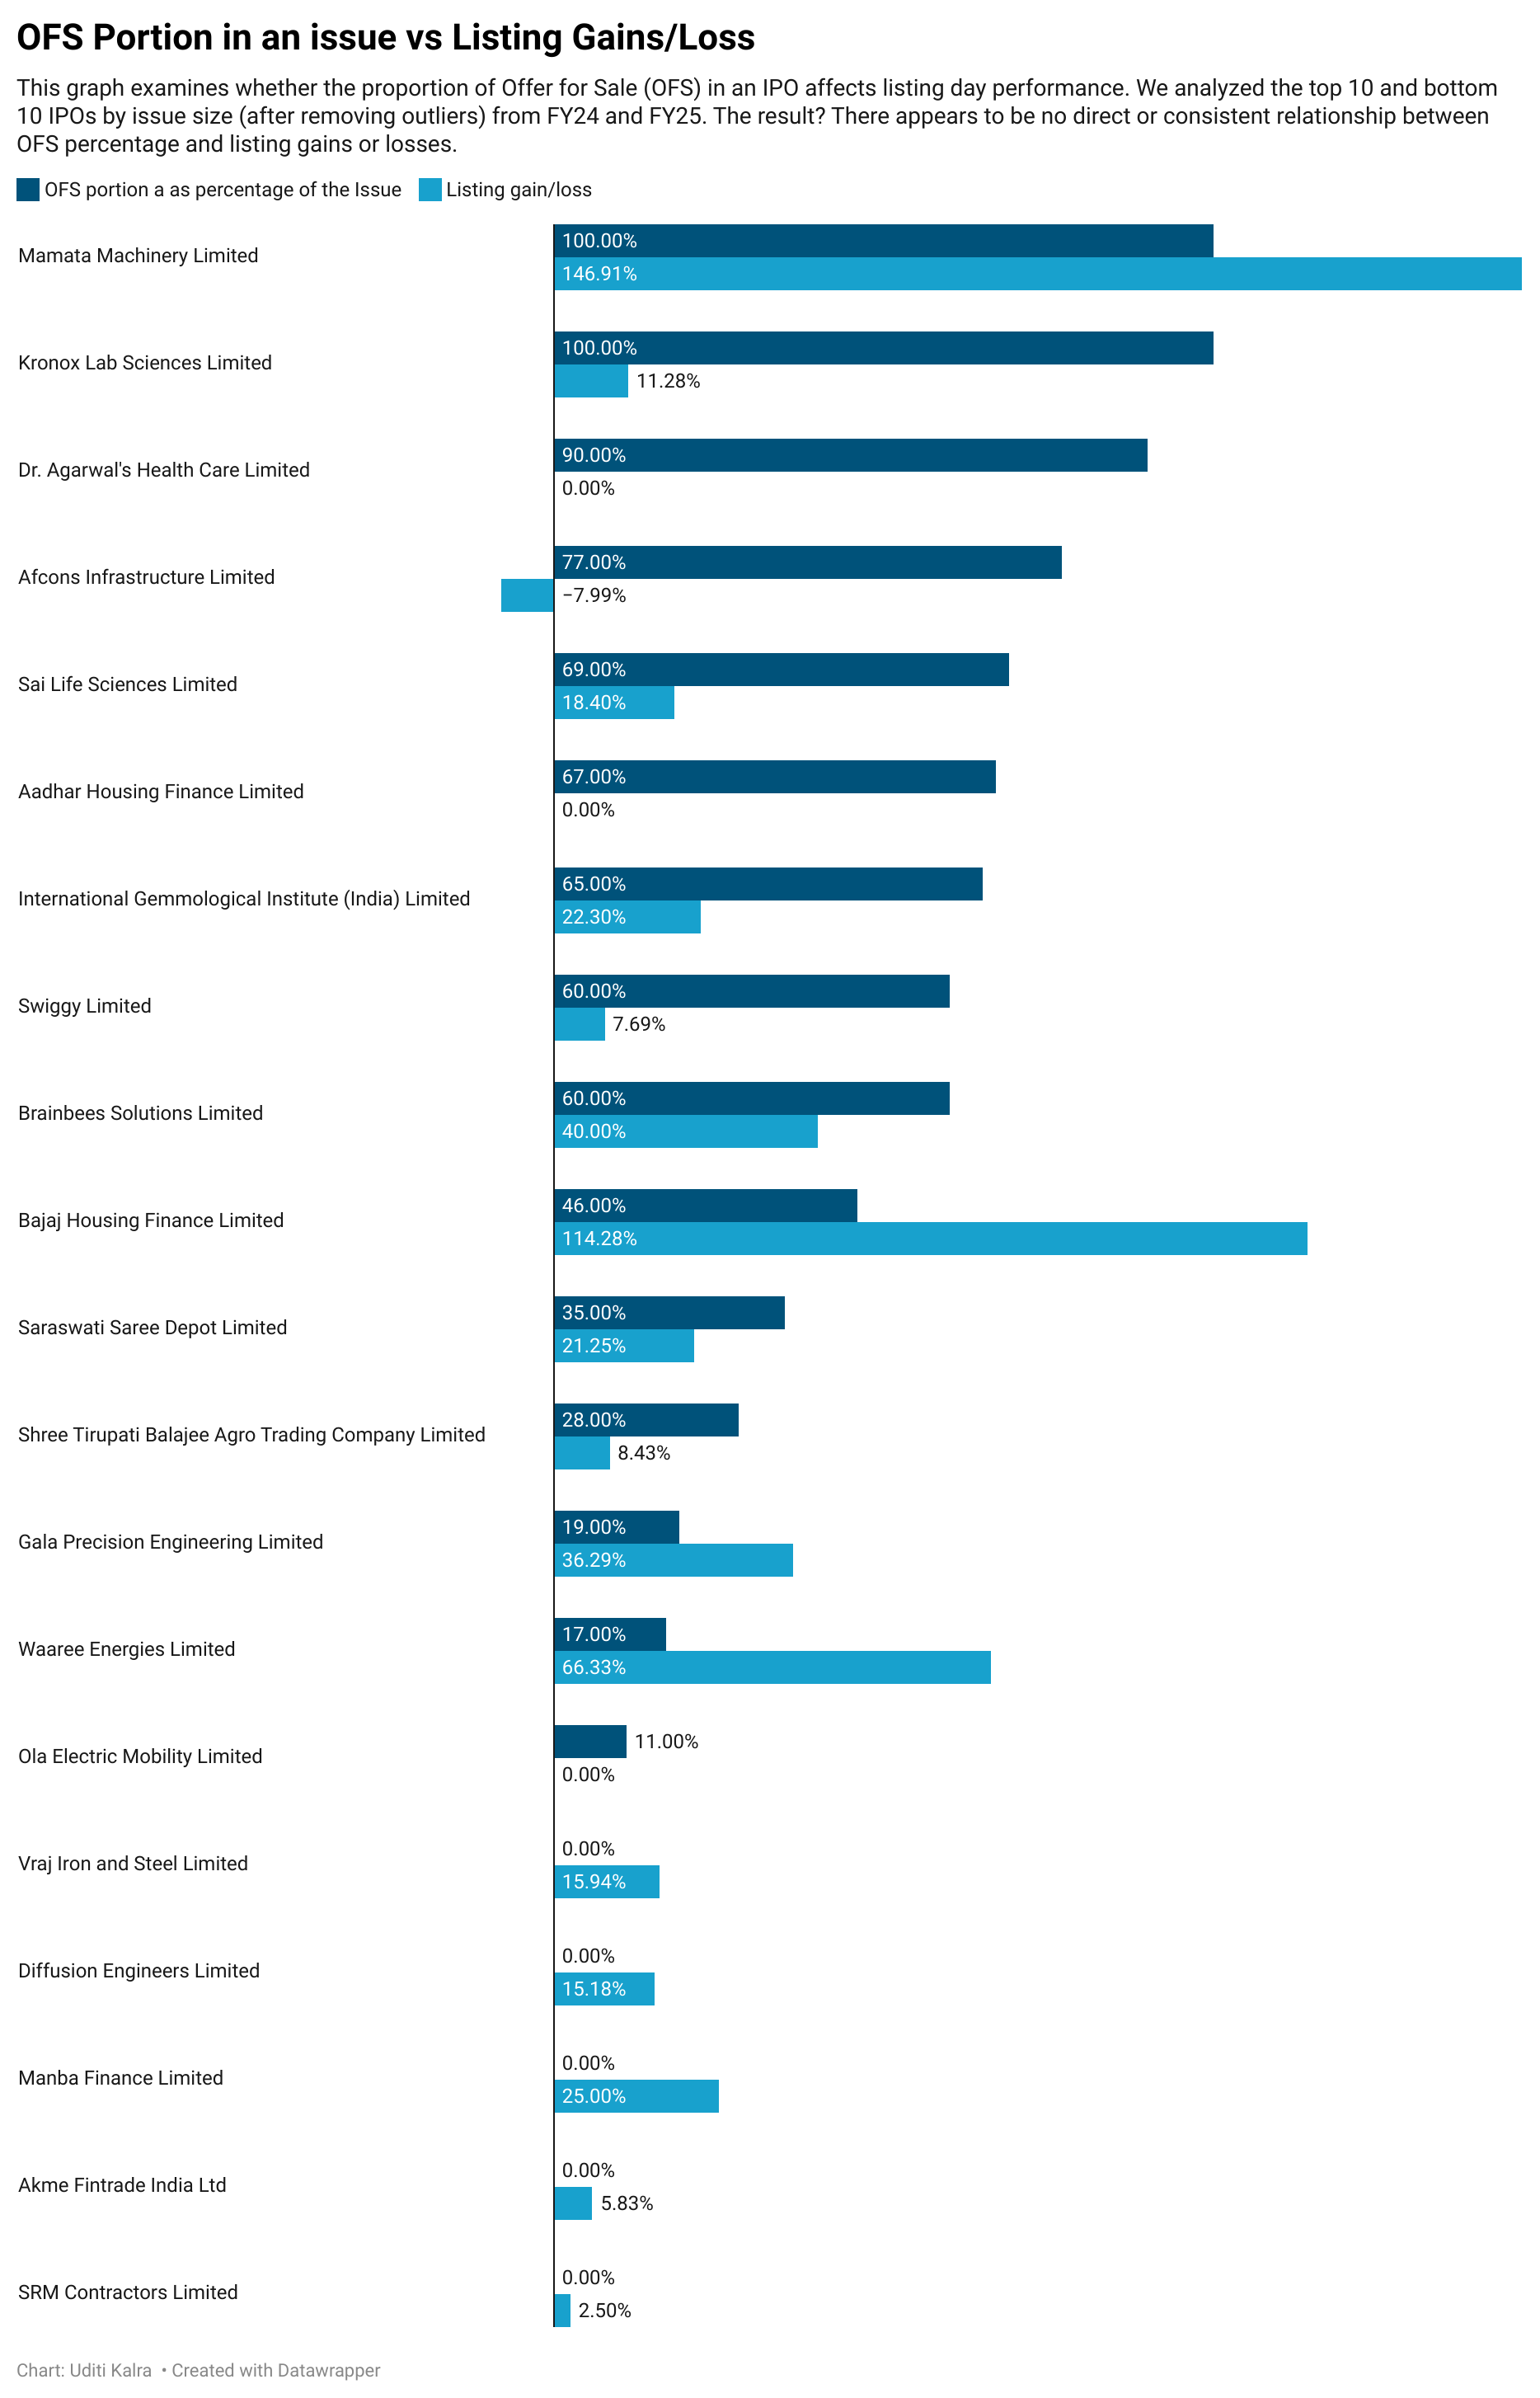
3. OFS% in an issue VS Listing Gain/Loss

When I analyzed the top 10 and bottom 10 issues by issue amount against their listing gains/losses, the correlation was much weaker.

Pearson correlation coefficient: +0.2113 Link

What does this mean?

+0.21 indicates a weak positive correlation
Key Takeaway: OFS percentage doesn’t strongly predict listing day performance

Hypothesis Validation & Conclusion

This analysis confirms our hypothesis with clear evidence:
  1. Higher OFS % → Lower Subscription Rates
  • Moderate negative correlation (-0.30)

  • The relationship is meaningful and consistent.

  • Investors show moderate preference for fresh capital deployment

  1. Minimal Direct Impact on Listing Performance
  • Weak positive correlation (+0.21) with listing gains.

  • Other factors dominate listing day performance.

  • OFS is not a strong predictor of immediate returns.

The Bottom Line: OFS percentage has a moderate impact on investor appetite, with higher OFS leading to notably lower subscription rates. However, when it comes to listing performance, OFS structure plays a minimal role.

Key Insight: Investors are rational - they subscribe less enthusiastically to high OFS issues but listing day performance is driven by broader market factors beyond just OFS structure.

References:

OFS Vs Fresh Issue
OFS Vs Listing Gains

6 Likes

Thanks for digging this up. :slightly_smiling_face::+1:t4:

Especially focussing on correlation and not claiming causation.
That -0.30 correlation is definitely actionable info for anyone evaluating IPOs.

Now that the OFS% - Subscription-level correlation has been established,
i wonder what other confounding variables are hiding in the background.

Business viability could be one.
Weaker companies would have both more OFS pressure and lower investor interest.
But there’s probably other stuff at play too -

@Uditi_Kalra, in your analysis, did you come across…

  • any sectoral patterns?
    • Some industries have higher risk tolerance from investors?
  • any market phase/timing patterns?
    • Bull market periods having higher risk tolerance from investors?
  • any other such “confounding variable” patterns in the data?

PS: Unable to view the spreadsheets using the 2 reference links at the end of the post.
Could you update links with the permission “Anyone with the link can view” in Google Sheets.

1 Like

Great analysis!
It aligns well with the general market perception that OFS = promoters offloading their stake → often seen as a red flag by retail investors. It’s almost like the company is asking for a big cheque without giving fresh value in return, so the dip in subscription rate makes sense.

But the listing day data is surprising, I assumed high OFS would drag down listing performance too. Looks like the market momentum and investor sentiment still dominate.

One thing I’m curious about:

  • Do we have any granular data on the breakdown of OFS subscription by category? (Retail vs QIB vs HNI)? Would love to see if retail investors are the ones still subscribing heavily to OFS-heavy IPOs, or if the institutional side is more cautious too.

  • Also Did IPOs with higher OFS % also come with more aggressive valuations? Would be interesting to check if high OFS correlates with steeper pricing.

Good insights.

My thoughts exactly.

I have another variable in my mind, that i believe is influencing the subscriptions to some extent, “The GMP”

@Uditi_Kalra Maybe in the future, you could also analyse the influence of GMP (grey market premium) on the IPO subscription rates.

If we start collecting the data of GMPs prevailing at the time of IPO, we can see how much they influence these subscriptions.

Maybe the GMP would explain the irrational behaviours or outliers in the above analysis.

If OFS % actually influenced the subscription rates, a higher OFS% should have naturally resulted in lower listing gains because when demand is weak, logically the listing gains should have been sub-par. But somehow that doesn’t seem to be the case in your analysis. (I understand there could be more things at play, than just OFS%)

I feel, irrespective of the OFS / fresh issue %, or how strong/weak the fundamentals of a company is, to a large extent, the subscription rates do seem to be influenced by the GMP data published on few sites which are dedicated for this.

I have no idea what a grey market is, or how it works, or how real these GMP data are, or if they really represent actual off-market demand for a stock. But, if GMP actually influences the subscription rates, ppl can easily rig this data by paying these websites to show higher GMP, to make a company’s IPO look attractive.

In my limited observation, sometimes I felt an IPO stock would underperform (trade at discount or at small premium) while listing, either due its weak fundamentals or high OFS % or both. I was surprised to see that, on most occasions, such stocks had decent listing gains, mainly because the subscriptions were influenced by the GMP figures more than the prospectus of the IPO.

Maybe, there is no method to this madness, it is just greed, and all it takes is an attractive GMP to make ppl subscribe to an IPO (even when OFS% and fundamentals look unattractive)

We can expect rational behaviour (worry about OFS% or weak fundamentals) only when ppl intend to hold a stock for long-term, it appears that most ppl don’t hold IPO shares for more than a week :point_down:, it is all about making a quick buck.

1 Like

Continuing my previous analysis, I explored market phases and their effect on subscription rates.

Market Phase VS Subscription Rates

Data: Analysed the same dataset of 69 IPO’s that were done for the previous report.

Year-over-Year Market Trends:

  • Flat market phases actually showed higher average subscriptions (101×) compared to Bullish phases (68×)
  • No Bearish phase to check for IPO’s in this data set.

Month-over-Month Momentum:

  • This made more intuitive sense - Upward MoM trends saw higher subscriptions (87×) vs. Downward trends (68×)
  • About 27% difference, which suggests short-term momentum definitely matters

Key Takeaway: What’s interesting is that short-term market momentum appears to be a stronger driver of investor interest than longer-term market trends. Investors seem to respond more to immediate market sentiment than the broader yearly picture.

To explore this dataset in detail - click here.

1 Like

OFS Influence on Investor Categories

Data: Analyzed the top 5 and bottom 5 IPOs by issue amount to understand OFS impact across different investor categories.

Key Findings:

  • Retail investors are most sensitive to OFS levels with a correlation of -0.41 - they clearly avoid OFS-heavy IPOs
  • HNI/NII investors show moderate sensitivity at -0.22 correlation
  • QIB/Institutional investors are least affected by OFS levels at -0.13 correlation

What the Data Shows:

  • Companies with 0% OFS (like Diffusion Engineers, Manba Finance) saw massive retail participation (85×, 144× respectively)
  • High OFS companies (60-100% like Swiggy, Kronox Lab) had much lower retail subscription (1.14×, 54×)
  • Institutional investors maintained relatively stable participation regardless of OFS levels.

1 Like

GMP VS Subscription Rates and Listing gains/losses

Data: Analyzed the same top 5 and bottom 5 IPOs by issue amount to understand GMP impact on subscription rates and listing performance.

Key Findings:

  • GMP shows weak influence on subscription rates (0.05 correlation) compared to OFS impact
  • GMP has moderate correlation (0.40) with actual listing gains - stronger than OFS impact on listing performance
  • Direction is opposite to OFS: Higher GMP = Higher Subscription vs Higher OFS = Lower Subscription

Key Takeaway:
GMP is more reflective of demand than a driver of it. While it’s often seen as a signal for listing performance, the data suggests that strong subscriptions are what push GMP upward, not the other way around. In this sense, GMP tends to follow market sentiment rather than lead it.