Hi, Is there any feature or indicator on Zerodha Kite that visually shows circuit limit revisions directly on stock charts, similar to what’s shown in the uploaded screenshot?
Circuit limit revisions can have a significant impact on positional strategies. Currently, since Zerodha doesn’t support custom indicators on TradingView, I have to manually check for these changes there - which adds extra effort.
Just wanted to check: Does Zerodha already offer such an indicator? If not, are there any plans to introduce this feature in the future?
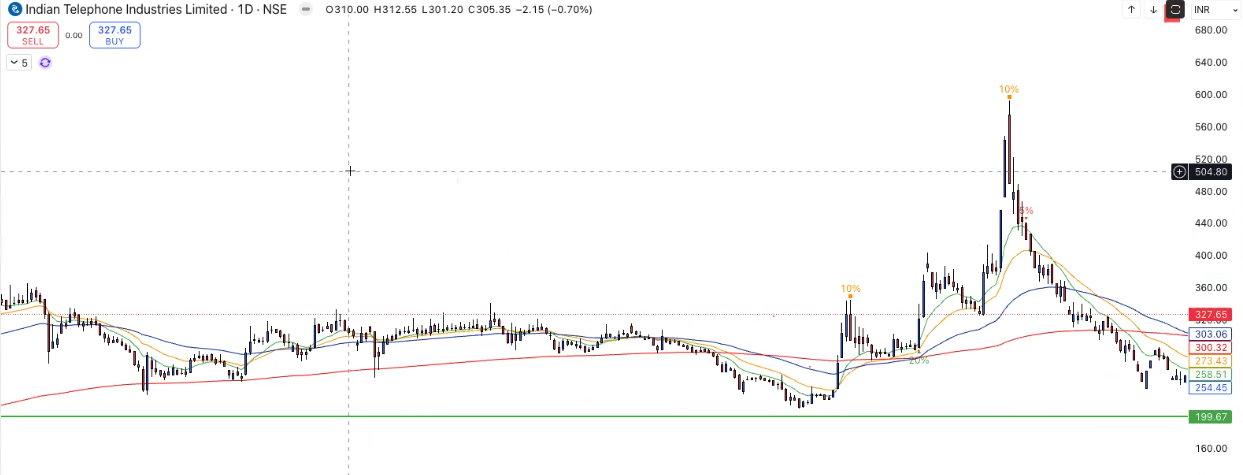
This feature is especially useful for swing and positional traders. When a stock is in a strong uptrend and its circuit limit is reduced—say from 20% to 10% or 10% to 5%—it often precedes a phase of profit booking or signals that the rally is cooling off. It serves as an early indicator for traders to consider securing gains or adjusting their strategy.
I can’t add more charts here, but if you look at the charts for CDSL and RVNL, you’ll notice that both stocks made a near-term top immediately after the circuit limit was reduced to 10%. These circuit limit changes can offer meaningful technical insight for us.