Hi,
I was reading moving average chapter from varsity and I had a doubt. Please refer to the chart below of ambuja cement which the author gave as a reference.
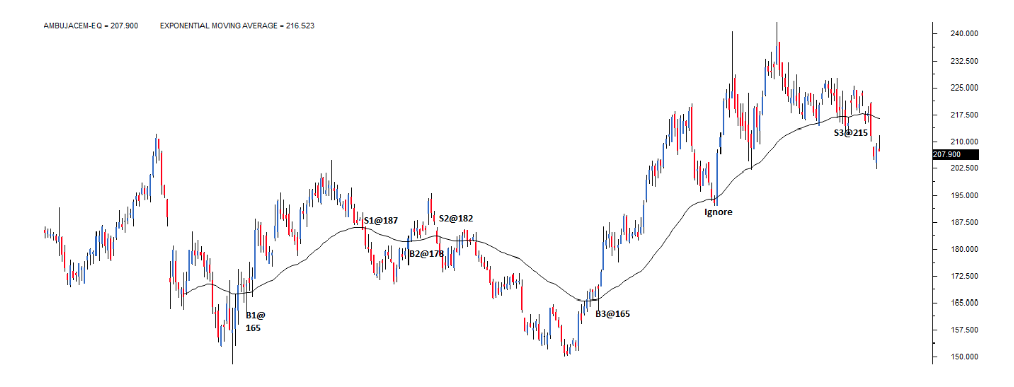
The author says, "Starting from left, the first opportunity to buy originated at 165, highlighted on the charts as B1@165. Notice, at point B1, the stock price moved to a point higher than its 50 day EMA. Hence as per the trading system rule, we initiate a fresh long position.
Going by the trading system, we stay invested until we get an exit signal, which we eventually got at 187, marked as S1@187. This trade generated a profit of Rs.22 per share."
My doubt is, It is ok to see an old chart and say here the current price is above 50 days EMA so we should buy and vice versa. But when I am actually trading, I won’t get this complete chart. I would rather be sitting at day B1 or S1 or B2 or S2 or so on, and I have to make a call whether to buy/sell or not. I won’t have chart of its succeeding days(like author shown as an example).
When I am trading, say I am at day B1, the moving average might move sideways(flat after that). How is that even useful then?
Best,
Pankaj
This is a plain vanilla explanation , in actual trading , as you are observed , one need to adjust the moving averages and need to check it in higher time frame like weekly & monthly . Using a single moving averages is not useful , but need another lower moving average also.
I understand what you are saying but with even a different time frame(say 21 EMA or 9 day EMA), in the above chart, it will still lag.
Sitting at point B1 in actual scenario(when I am trading), we can’t be sure if being on the top of 9day EMA is actual sign of upward momentum(like the author did, cause he was looking at an old chart and he can actually see all those movements). After B1, it could be a flat movement also, no?
One way to avoid whipsaws in realtime is wait for candle to close above Moving Average and then Buy.
Thanks for the reply.
I think I am still not able to explain it clearly. My doubt actually was, author mentioned different points in the above chart where to buy where to sell, but in realtime trading, we wont be having succeding day charts like he has access to, so, even if close of the candles end up above EMA, it is still not sure if the trend will be bullish, it can be flat(or bearish also).
@LightYagmi
Hehe, i assume you are new to technical analysis.
You don’t use MA alone. you use it with price action analysis or any other kind of technical analysis.
Also learn the tools and build your own strategy, don’t learn other people’s trading systems/methods.
Every strategy only gives you entry point, what happens after that is unpredictable. It is easy to interpret entry and exit points on historical charts but not at all easy to replicate the same in realtime.
2 Likes
Here time frame means not 21 EMA OR 9 EMA , ITS THE CHART DURATION say "Daily chart " "weekly Chart " , obviously moving averages lags , since they are dependent on price action , in shorter period always , there will be more whipsaws, you need to change the moving averages according to the trade taken , be it intra-day or Swing trade.
Of course , but the challenge is to analyze the future price moment based on previous price movement with the help of moving averages & price charts ,and taking actual trade, based on money management & capital , That thing has to be decided by the individual trader/Investor
1 Like
Yes, very very new  Thanks for the reply.
In technical analysis, the idea is to find that entry and exit point (take price or stop loss) which is feasible for your trading style. Each strategy you learn will have its own set of rules that help in identification of entry and exit. They may be similar or sometimes contradictory. The above mentioned chart, I suppose was only for educational purpose, as traders use multiple strategies or indicators to identify a particular trade.
To ideally trade on any strategy or a combination of strategies, one must first learn about several strategies commonly used, Backtest them to evaluate their effectiveness in different market trends and paper trade in the live market to gauge if the signals still hold good. Once you have developed convection in the strategy, and it is working best according to you risk reward appetite, only then it is advice-able to trade in the live market.
1 Like
Chart analysis is like number counting in Black Jack(read up on that). The price action every second is a card delt to the traders. Many leave it, some take it and others lose it. What cards do you take and how much risk can you stomach determines your returns.
Mathematicians these days are not allowed in casinos so they are filled to the brim in stock market with sophisticated algorithms and high speed computers. These algos, technicians, chartists, you name them, decide which card to take, hold or lose based signals like moving averages, bands, channels, candle stick types, cross overs and much more. When you learn the technical analysis, you are learning how to “Play” seriously.
It is fun, when you see the market as a big card game. Games have been efficient in determining the best and disciplined(MS Dhoni). Games in the market are pretty serious, and the money that moves determines lives and destinies(Warren Buffett). Market needs the best and disciplined. The best(Ray Dalio, The Turtles …) retained their position with a solid strategy, that had real “Edge” for some time, and new best got selected.
Intention is to pique your curiosity. Welcome to the Wonderland where the learning never stops, and creativity is credited with real money. Disciplined Trader by Mark Douglas has to be the foremost in your reading list.