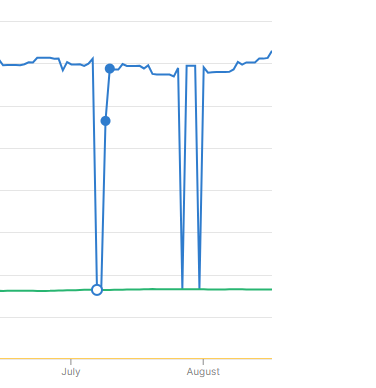
I dont know why but equity curve keeps having unnatural falls. I manage 2-3 accounts and its always on random days and i have to create tickets to get it fixed.
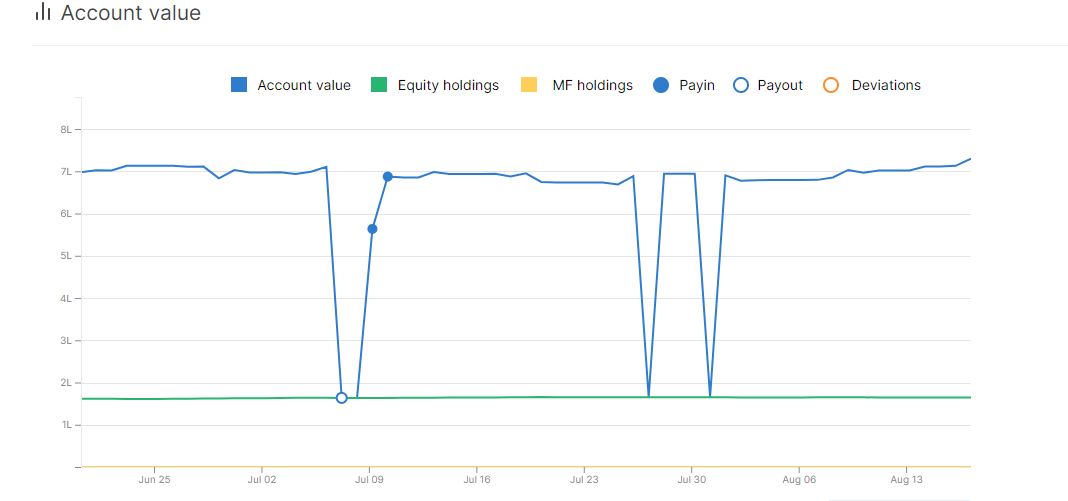
Like in this image, there is no reason for the fall and rise on 27-7 and 31-7. I didnt buy anything with all my free cash and sell the next day. In fact i havent done any equity buying/mf investment since a long time and have only been doing fno trading(option selling only) and mtm loss/gain is 10-20k which is not much compared to ac value of 7 Lakh and there is no reason for such falls and rises. Please investigate why this keeps happening on random days in random accounts.
This is linear and easy to spot and point out. Suppose if the new NAV curve has issues, i doubt whether i will be able to fully understand whether i am looking at the correct data or not since calculation is complicated. @nithin
So Support replied again and told me it was due to liquidbees. It is literally the free cash which went to 0 and came back up. (The first one was due to quarterly settlement. I am talking about the falls on 27-7 and 31-7) The equity holdings didnt fluctuate like that(so it wasnt liquidbees). And i own 50k worth of liquidbees while my curve fluctuated by 5 lakh. Can 50k liquidbees cause 5 lakh fluctuation of free cash.
The cash balance figure was missing in the curve @emrys11 we’re checking, you’ll get an update on your ticket once it is fixed.
It has nothing to do with pledged holdings, there seems to be miscommunication. We’ll have this clarified.
We’re also working on a new flow for generating an account value curve, which will solve the issues of missing data on specific days for various reasons, so the new NAV curve is also taken care of.
I also have this issue and had raised a ticket on August 5, 2023. #20230805753636
The support team just closed the ticket stating they are working on a new flow. It has been more than 2 months now and the issue is not fixed and the new flow is not live yet.
@nithin - Two things I liked about Zerodha were quick resolution of tickets and good quality reporting tools. Now, I raised an issue about the equity curve, which was closed with some standard response that I see all over (TradingQnA, twitter etc.) across all such queries. 2 months after reporting the issue, it isn’t fixed and they simply close the ticket. There used to be a tag called “pending fix” on the tickets earlier, which at least meant that the team is working on it. Just closing the ticket is not right. Sorry for the rant!
I have almost given up on this. This 2 month might never get over. And the curve keep glitching every few days. I had also raised ticket last week and no fix yet.
I got a call and was told that they were “hoping” this issue would get fixed in the new equity curve that is being launched. If it didn’t get fixed at that time, it may not be fixed at all.
Now, I see the new equity curve is launched? - as I can see the previous years data… however my issue is still unresolved.
If you can’t fix a chart, how am I to trust with lakhs of investment portfolio with you guys? Very disappointing after being a zerodha fan for 7 years
I just checked. They have launched the same curve but extended it to account creation date. That’s nice but no analytics at all. No xirr or comparison with index or proper nav curve.