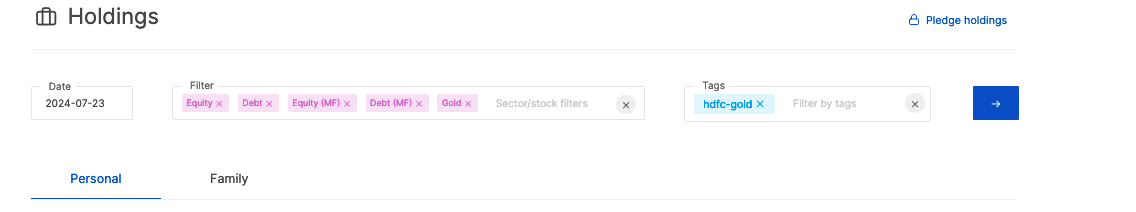
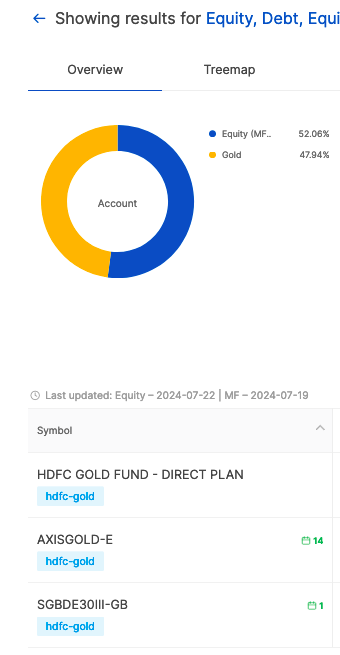
Is there a way to use tags to analyze the portfolio breakdown ?
For example, if I have these Symbols:
HDFC Gold MF tagged with gold = 10 ₹
SGB listed tagged with gold = 10 ₹
HDFC liquid fund tagged with debt = 20 ₹
Motilal oswal index fund tagged with equity = 60 ₹
So there should be a pie chart or a table which shows that gold allocation is 20 %, debt is 20% and equity is 40%
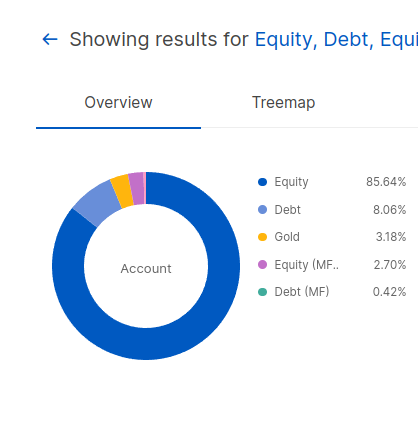
Currently the analysis pie charts are not very helpful when it comes down to
Arbitrage: It shows hedged exposure as unhedged equity also which needlessly increases the weight of listings like HDFC or SBI or Reliance because arbitrage also invests there.
Debt index funds: they’re counted in equity MF also and I can’t see the % of debt in my portfolio
Console asset categorisation donut shows `Equity, Debt, Gold, Equity-MF & Debt-MF`. I am unsure what youre looking for. Could you please DM your client ID? We'll reach out for more details.