Let us say there is an important event - the RBI policy, GDP data, or the budget. You want to know what direction the market will move after that event. One way to back your guess on market direction is to look at OI formation after that timeframe.
This is now possible with the new timeframe selectors in Sensibull’s Open Interest charts.
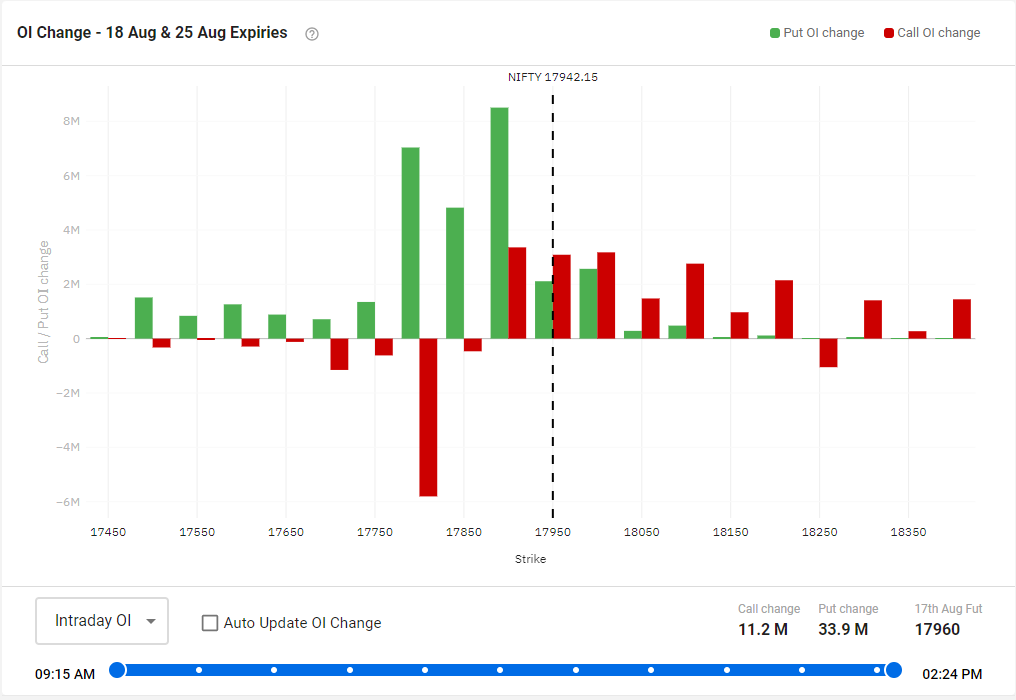
Now you can see the Call and Put activity in the market at any time interval during the day. If the event is at 10 AM, set the time selector to 10:00 AM to see the options activity right after the event.
And for you to try this out, we’ve made our Open Interest feature free for the next 3 days!
Try this feature out for free: Click here