How can we identify (Purely Technical, Different time frames required) that a Particular Stock or Index will give Gap Up/Down opening?
If Possible explain in detail
1 Like
Traders use certain previous days intraday patterns to make a hindsight guess to determine if a stock might open GAP UP or DOWN .
17 hours between today’s closing and next days opening, a lot of geo political, fundamental changes could happen during this 17 hours gap. Which is beyond the traders control and analytical skills.
However, Some patterns observed by BTST / STBT traders are:
-
INCREASE in PRICE + VOLUME + OI between 2.45 to 3.20 pm for BTST
-
DECREASE in PRICE, INCREASE in VOLUME + OI between 2.45 to 3.20pm for STBT
-
Last minute Institutional accumulation for BTST.
-
Continuation of Today’s intraday TREND based on fundamental news release. etc etc
3 Likes
Very true indeed
Where should I look out for OI in Kite or Pi
Or any other platform, If not available in above two
Okay I’m just going to write down a bunch of things I observed and hopefully you can collate something from it. There is a larger picture to this gap up/gap down scene.
If a stock opens gap up, in what scenario has it opened gap up wrt previous close and will it continue moving up or will it fall from the high levels. Similarly, if a stock opens gap down, in what scenario has it opened gap down wrt previous close and will it continue falling or will it recover and go up .
Here are some pointers you can use to narrow down a stocks movement from opening:
This is the one year chart of BPCL:
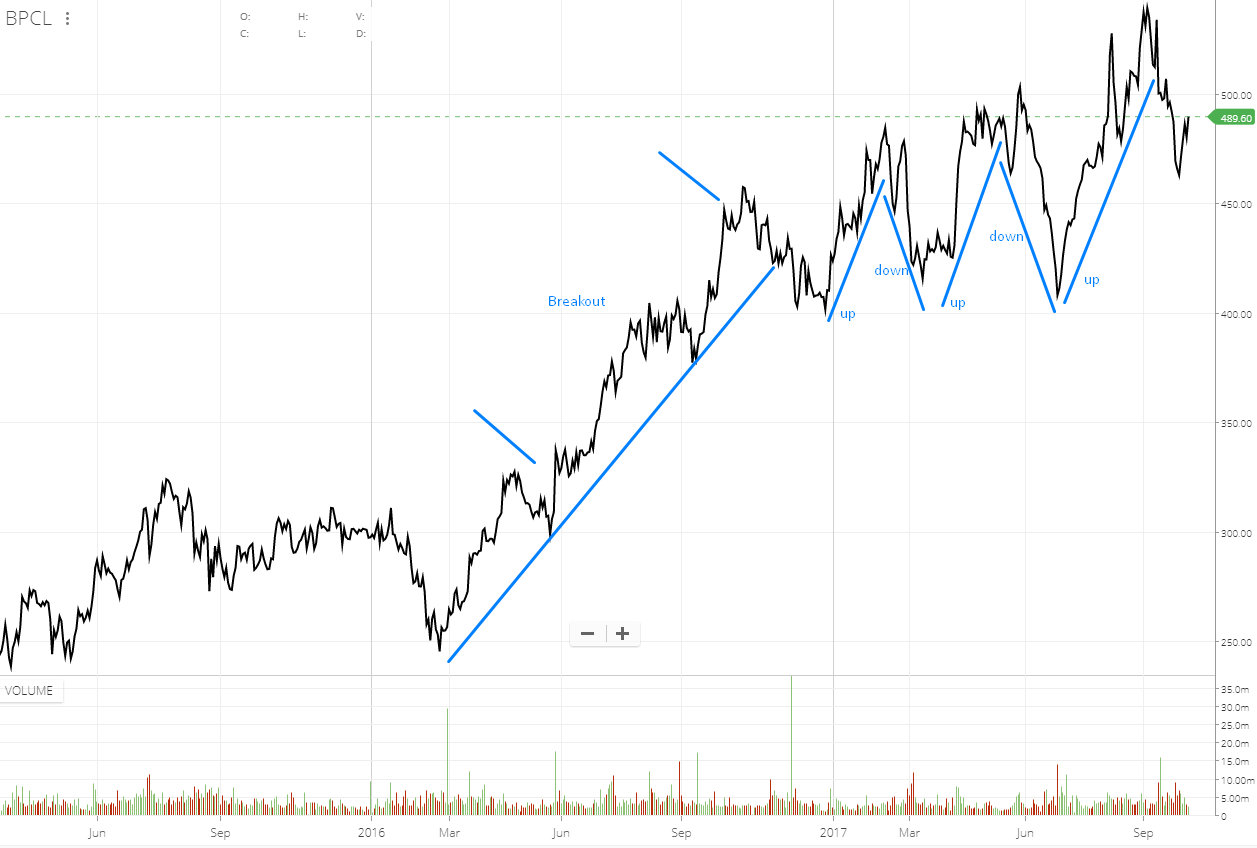
Observations:
- Big upmoves happen from crucial lower support levels.
If the stock decisively trades above an established resistance level and the index is in favour, it leads to a breakout to higher levels. A breakout usually has a combination of continuous buying days(days where the stock price goes up throughout the day) and gap down-close higher days(where the stock opens gap down but prices move up through the day and the stock closes above the previous close price). In this case, gap downs lead to further buying and they usually occur when the stock price moved up during the last half hour of the previous trading day.
When there is a reversal in trend where the stock starts to fall, one can usually notice gap up openings but the stock falls from the high levels and closes below the previous close price. In this case, the gap up happens when the stock price falls during the last half hour previous trading day.
- Big falls happen from crucial higher resistance levels.
An almost reverse scenario occurs here. A fall usually consists of a combination of continuous selling days(days where the stock price falls throughout the day) and gap up-close lower days( where the stock opens gap up but the prices fall through the day and the stock closes below the previous close price). In this case, gap ups lead to further selling and the usually occur when the stock price fell during the last half hour of the previous trading day.
When there is a reversal in trend where the stock starts to go up again, one can usually notice gap down openings but the stock goes up from these low levels and closes above the previous close price. In this case, the gap down happens when the stock price moved up during the last half hour previous trading day.
- Range bound periods
During both uptrends and downtrends, these will be range bound periods where the stock will oscillate between an established support and resistance level. It is during these range-bound periods that the stock decides where it goes next. During these range-bound periods, gap-ups are usually a sell and gap downs are usually a buy. These gap ups happen when the stock price fell during the last half hour of the previous trading day and the gap downs happen when the stock price moved up during the last half hour of the previous trading day.
So this all sounds a bit hazy but if you keep watching, it should hopefully start making sense to you
5 Likes
Through all of the chaos, there seems to be recurring patterns, time and time again. So the markets aren’t a random number game, after all. Glad to know that.
1 Like
Very good Observation
1 Like