Does the following image say the uptrend is still there…?
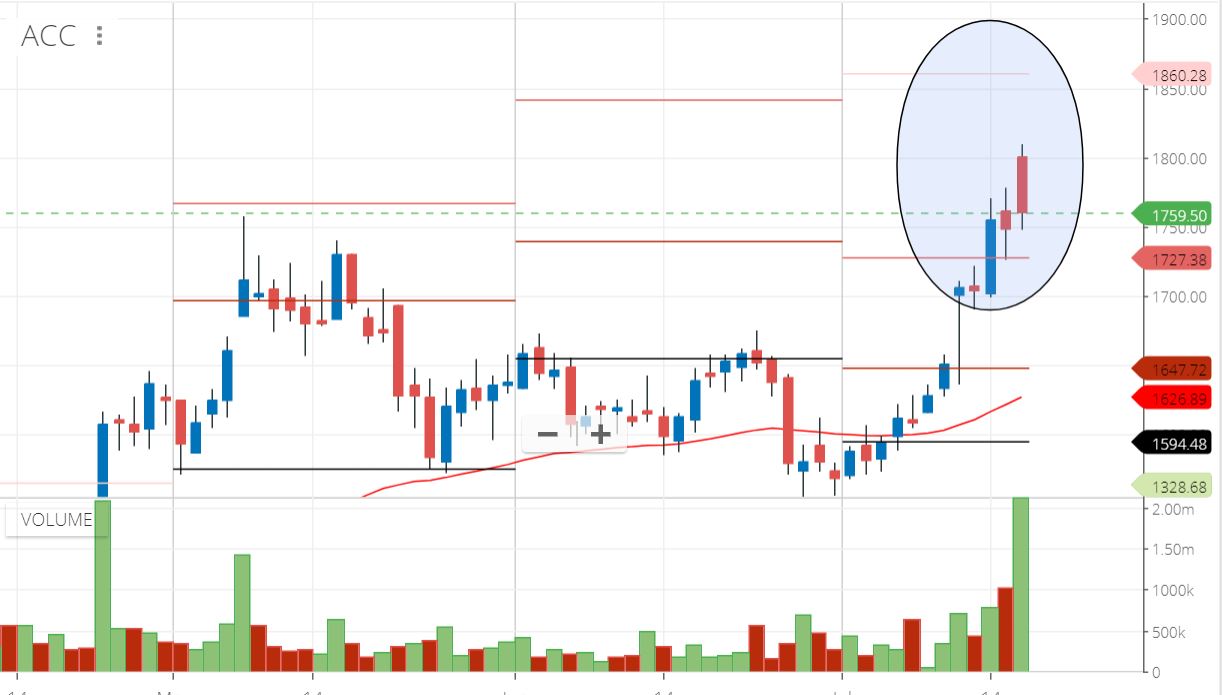
Clearly, the bulls tried to push the price higher at open but they were unable to sustain the high price. This is quite evident by the red candle which panned out during the day. It is also interesting to note that this has happened across two consecutive sessions.
I would read this chart his way -
- ACC has broken out of a consolidation phase (I’m assuming this is an EOD chart)
- The stock sustained to trend higher, although not very convincing (evident with the presence of dojis and spinning tops)
- However, the bulls managed to push the prices higher
- Maybe there is some sort of fatigue setting in for the bulls - quite evident with the price action over the last two days. This also leads to some sort of panic/discomfort with the bulls
- The volumes on the last day suggests that the bears were aggressive
Given all these factors, I’d think twice before setting up a long trade here.
Check this to learn more on Technical Analysis.
1 Like
thanks karthik… for the nice interpretation… yes it was an eod chart … and the scrip plunged down today…
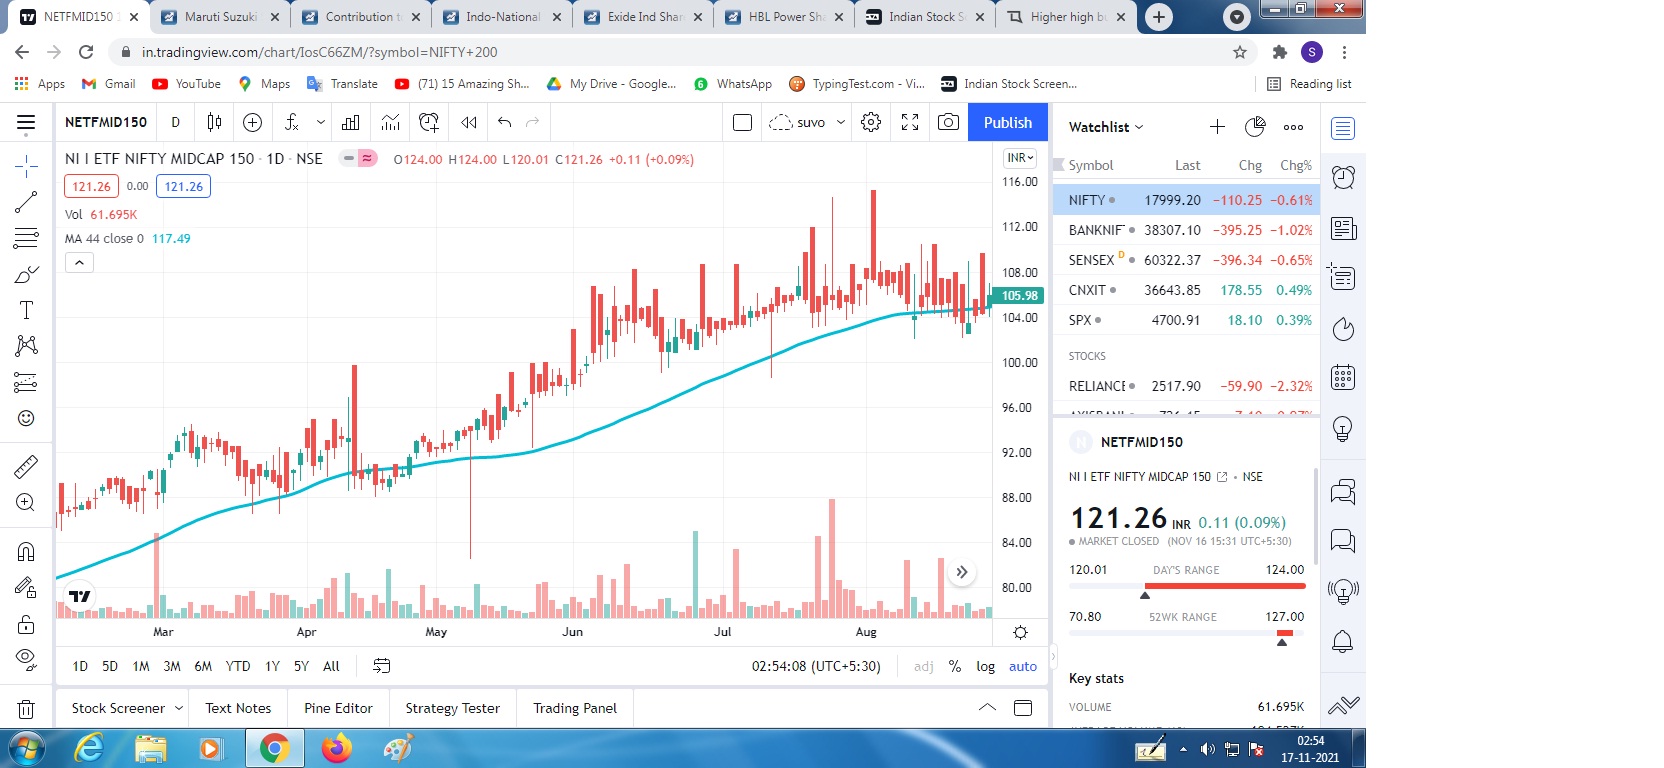
this is ETF.
I dont understand this. Why price went high?
1.) Because someone wanted to buy a lot of shares but did not want to buy at higher price, but had no option, so he had to pay higher price to purchase during that candle.
2.) Because someone wanted the price to increase, so they alone kept on puchrasing to increase price.
1st option makes sense to me. In 2nd option, why would someone increase the price at their own money expense?