SEBI recently shared its monthly dashboard for December 2022 and here are some of the key highlights:
Indices
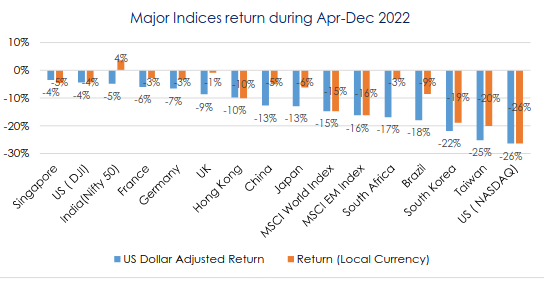
- Tightening liquidity and geopolitical tensions seen during this financial year triggered sharp corrections across stock markets. So far in FY23, Nifty 50 is the only index generating positive returns till date in terms of local currency while all the indices, including Nifty 50, are in the red zone in terms of US Dollar adjusted returns.
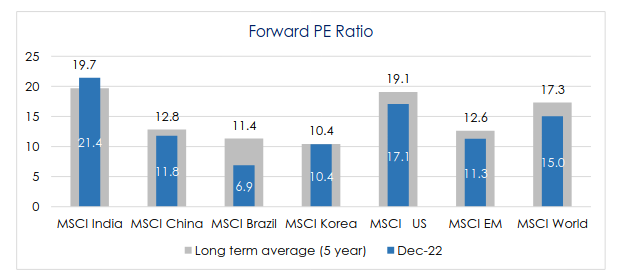
- Nifty’s valuation at 21.8 times price to earnings on trailing basis by the end of Dec -22 is 3% down from its valuation for Nov-22
Movement in Global Currencies against USD
-
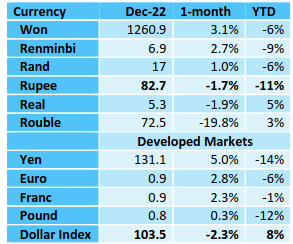
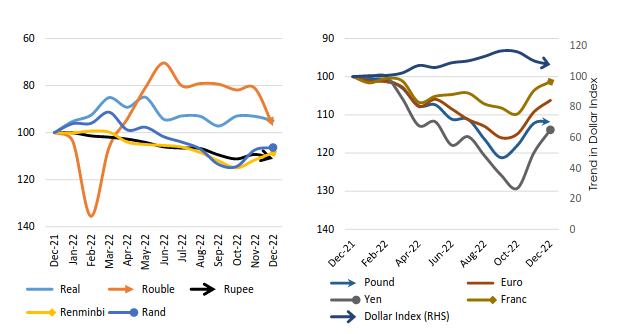
The global currencies, especially of the developed markets, continued appreciating against the US Dollar during Dec-22. However, few emerging market currencies like Rupee, Brazilian Real and Rouble weakened against the USD over the month.
-
By the end of 2022, almost all the currencies , except Brazilian Real and Russian Rouble, are down from their respective levels at the end of 2021, owing to the strong US Dollar appreciation amid aggressive rate hikes by the Fed to contain inflation. Indian Rupee too saw a fall of 11%, its biggest annual decline since 2013.
Trend in USD-INR Forward Premia
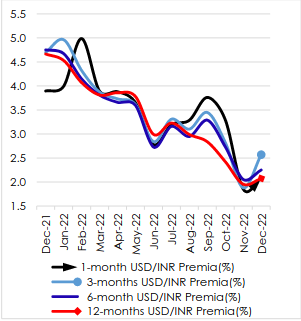
- During early December, USD/INR forward premiums continued declining and the 1 year USD/INR Premium slipped to its lowest level of 1.7% in more than a decade.
Investment Flows
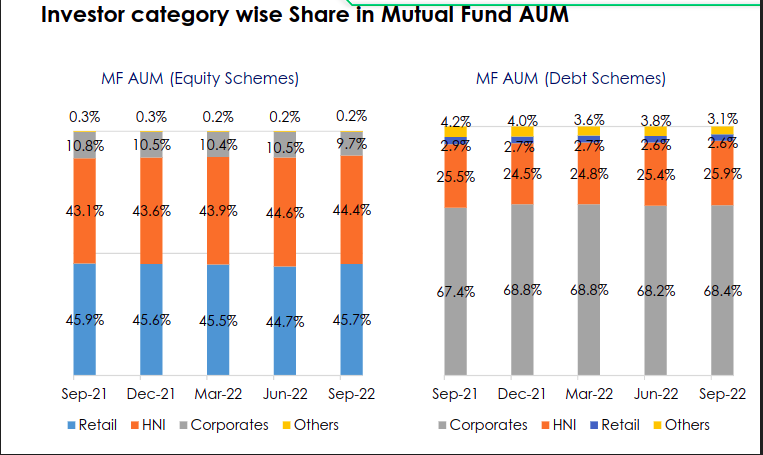
- During Dec-22, Mutual Funds made net positive investments into debt segment after months of outflows from the segment while they continued to be net buyers in equity segment.
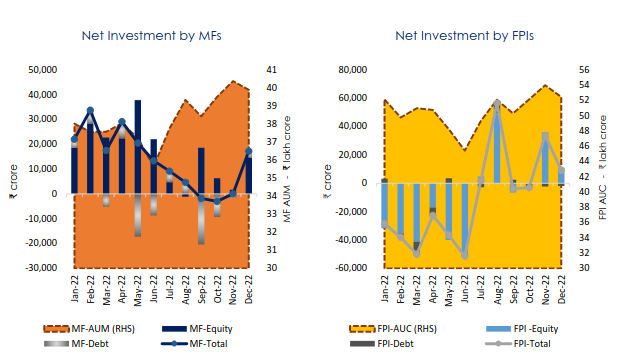
-
FPIs continued to invest in Indian markets in the month of December 2022, however the investments were far lesser compared to November. In the calendar year 2022, FPIs made net withdrawals of Rs.1.21 lakh crores from Indian equity segment.
-
The month of December also saw rebound in DII inflows reversing the trend of outflows observed in past few months.
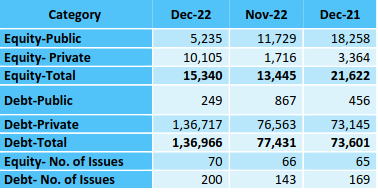
Resource Mobilization
- The primary market performed well in Dec 22 driven by 79% rise in amount raised through privately placed debt and 489% rise in preferential issues & QIP combined.
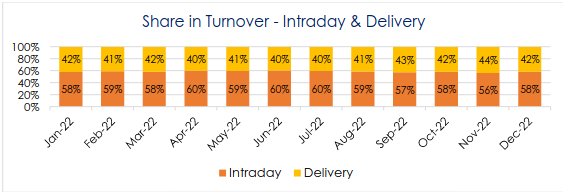
Trend in market share in Cash Segment Turnover
-
The number of demat accounts in India rose to 10.8 crore in Dec-22, 35% higher from a year earlier. With 7.1 crore new demat accounts opened since Apr 2020.
-
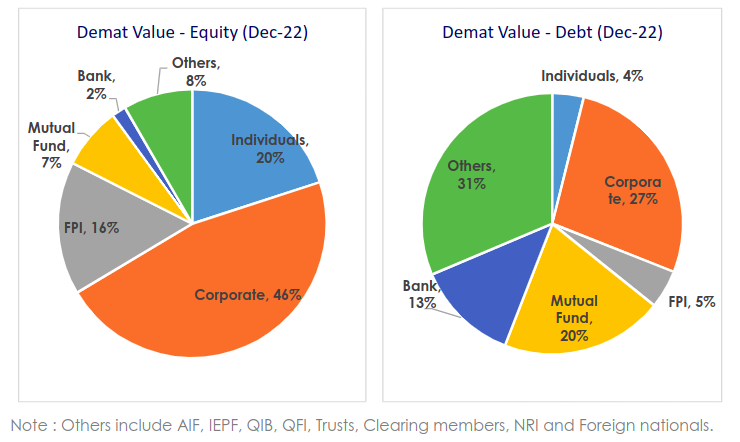
As of December 31, 2022, the total demat custody value stood at Rs. 373 lakh crores.
-
Corporates accounted for 46% of the demat value in the equity segment, followed by individuals and FPI holding 20% and 16% of the demat value.
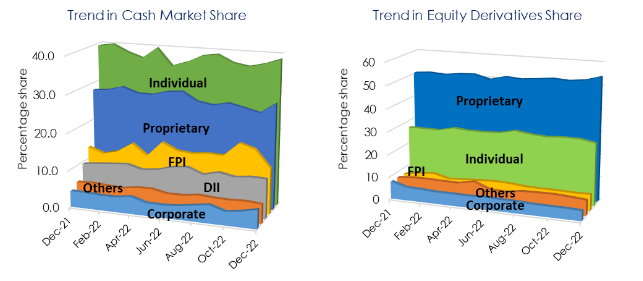
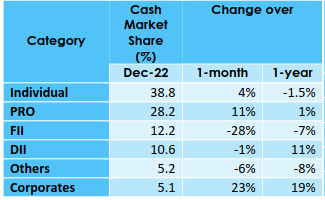
- Market share of proprietary traders, Individual investors, and corporates in the cash segment turnover rose by 2.8, 1.4 and 0.9 percentage points, in Dec-22, while that of FPIs declined by 4.7 percentage points.
Turnover Statistics
-
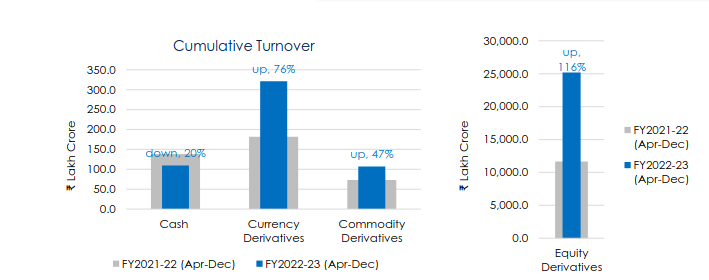
Cumulative cash segment turnover plunged by 20% so far in FY23 (Apr -Dec) relative to the same period of FY22, while total equity derivative volumes jumped by 116% for the period under consideration driven by proprietary traders and individual investors
-
Cumulative figures of currency and commodity derivative turnover also registered a rise of 76% and 47% during Apr-Dec 2022, as compared to Apr-Dec 2021.
-
Equity cash segment witnessed 3% fall (M-o-M) in trading volumes, compared to Nov-22, driven by reduced trading activity by FPIs. 36% (M-o-M) rise in trading activity is seen in equity derivatives segment. On the other hand, 15% fall is recorded in M-o-M turnover in currency derivatives.