SEBI today published a report analysing profit and loss of individual traders dealing in the equity futures and options segment. The report analyzes P&L of individual investors for the FY19 and FY22 periods. The periods of study have been selected keeping in view the influx of individual investors in the last three years, so as to comparatively analyze the trends before and after Covid-19 outbreak.
Some key highlights from the report;
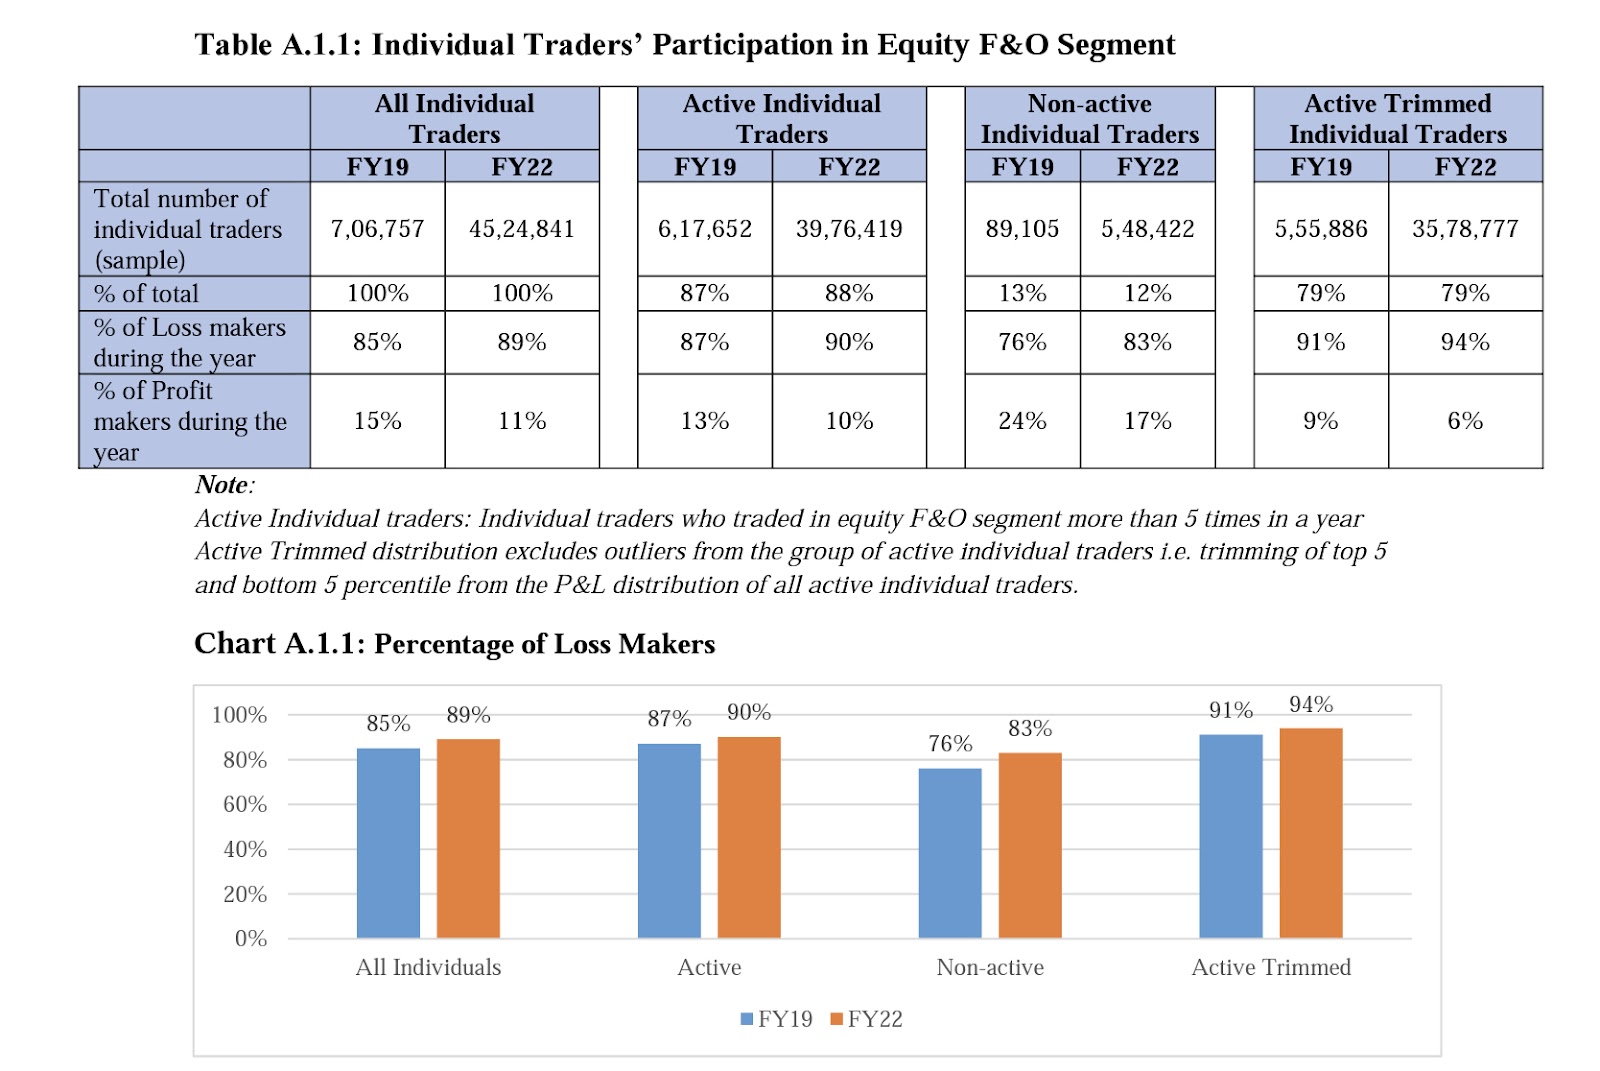
Total number of unique individual traders who traded in equity F&O segment was 45.2 lakhs during FY22, up from 7.1 lakhs during FY19. An increase of over 500% in FY22 as compared to FY19, of which 88% were active traders.
89% individual traders (i.e. 9 out of 10 individual traders) in equity F&O segment incurred losses during FY22, up from 87% in FY19.
The percentage went up to 90% for active traders and further to 94% on excluding the outliers from active individual traders’ group during FY22.
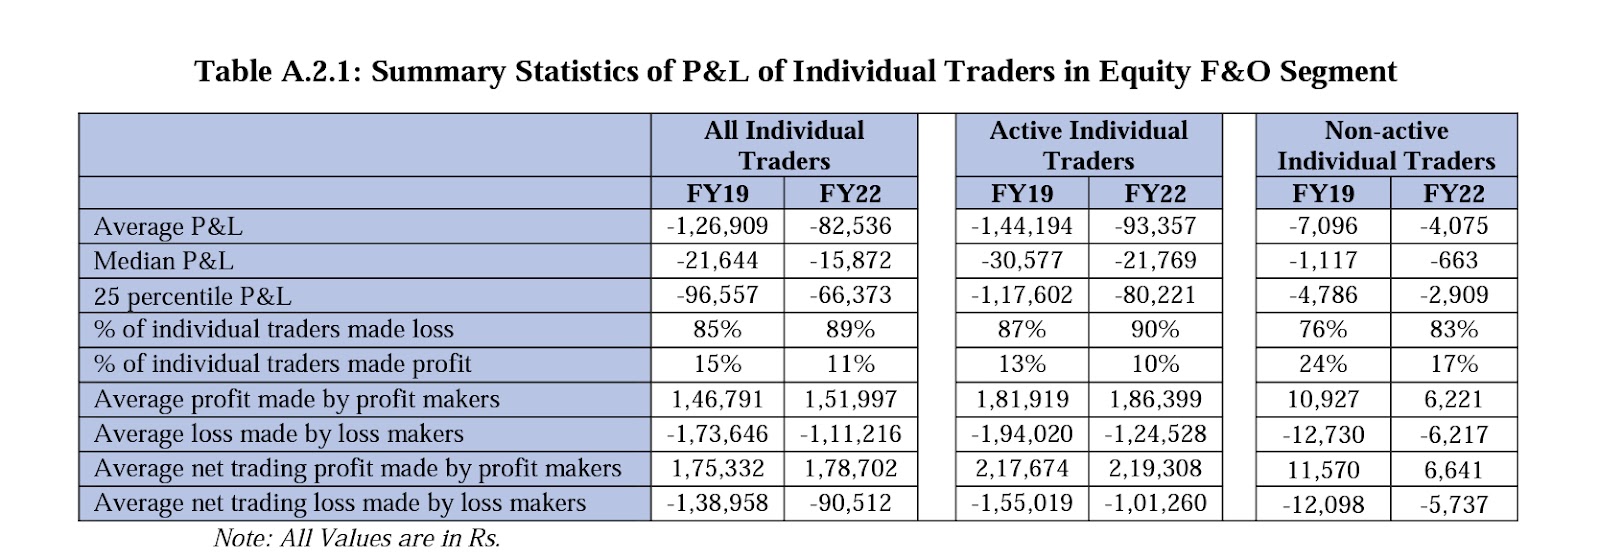
Individual traders in equity F&O segment incurred an average P&L of (-) Rs. 82,500 during FY22, down from average P&L of (-) Rs. 1.3 lakhs during FY19.
89% of the individual traders in equity F&O segment incurred losses, with an average loss by loss makers of Rs. 1.1 lakh during FY22.
Whereas, 90% of the active traders incurred losses with an average loss by loss makers at Rs. 1.25 lakh during the same period.
During FY22, 11% of individual traders in equity F&O segment made profit with an average profit of Rs. 1.5 lakhs. The percentage of profit makers declined marginally to 10% for active traders, though the average profit made by them went up to Rs. 1.9 lakh.

From the distribution of P&L of all individual traders, the average profit/loss incurred by active as well as non-active individual traders during both the years was below the 25th percentile of the entire distribution, indicating significant skewness in the below 25th percentile.
On average, loss makers registered net trading loss close to ₹ 50,000 in FY22. The average net loss of a loss maker was over 15 times the net profit made by a profit maker (for the group of active traders excluding outliers).
The top 1 percent and top 5 percent active profit makers accounted for nearly 51% and 75% of the total net profit earned by all active profit makers, respectively.

During FY22, individual traders belonging to age group 30-40 years had the highest share in participation (39%) across all age groups.
For younger individual traders (20-30 years), the percentage share of participation went up significantly from 11% during FY19 to 36% during FY22.
The share in profit by profit makers belonging to age group 20-40 years went up to 71% for active trimmed cohort as compared to 38% for all individual traders.
The individual traders belonging to age group 30-40 years accounted for the highest share (39%) in profit earned by all profit makers in FY22 (active trimmed).
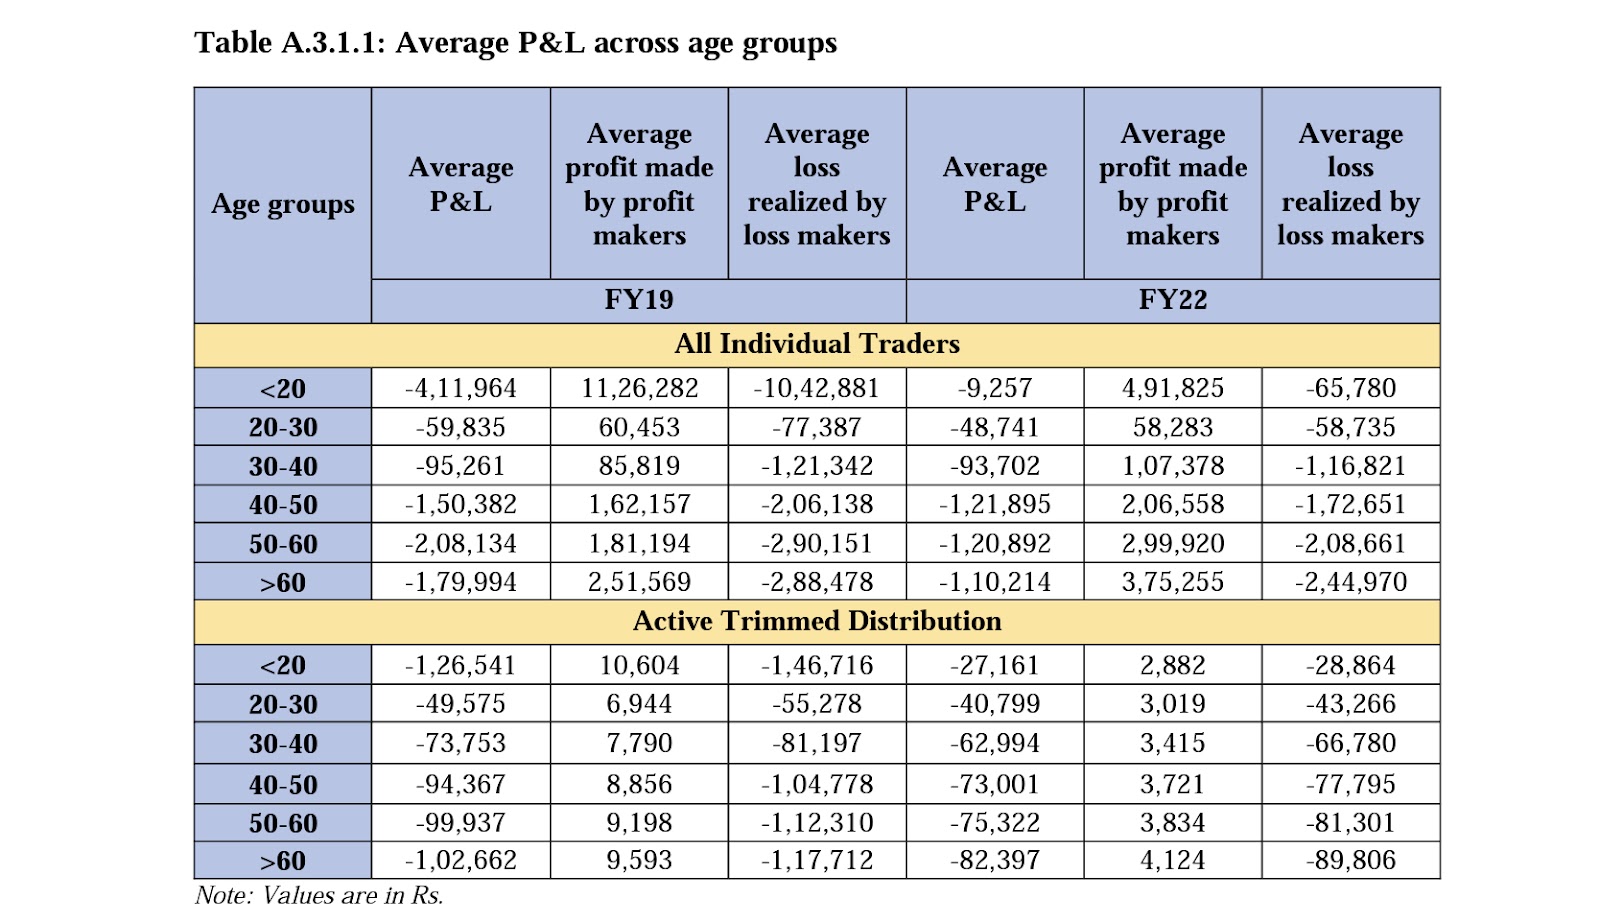
The average profit earned by profit makers belonging to the youngest age group (with below 1% share in participation) was highest as compared to all other age groups during both FY19 and FY22.
During FY22, the average loss made by loss makers was significantly low for the younger group (<30 years) of individual traders, whereas for senior citizens, it was highest.

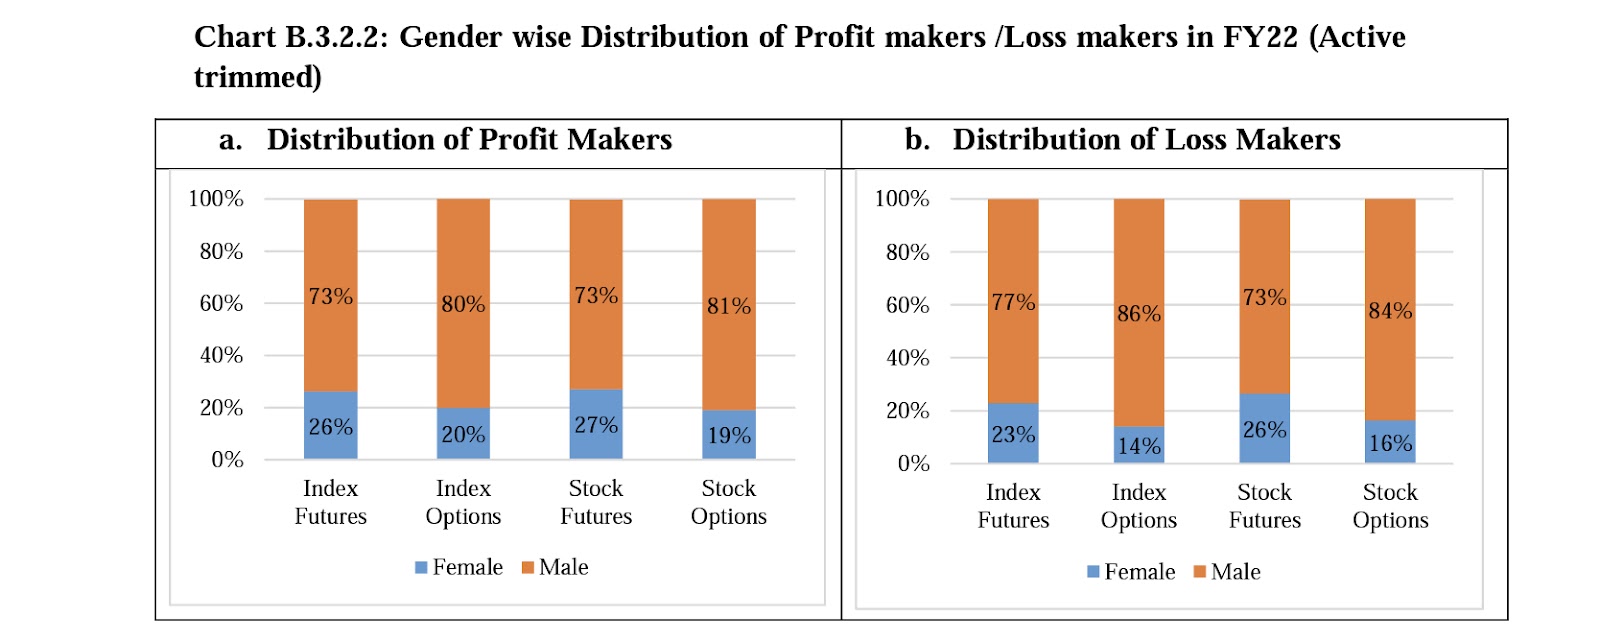
The trading by individual traders in equity F&O segment were dominated by males (>80%) during both the years. The percentage share for male individual traders went up to 84% during FY22 from 80% in FY19.
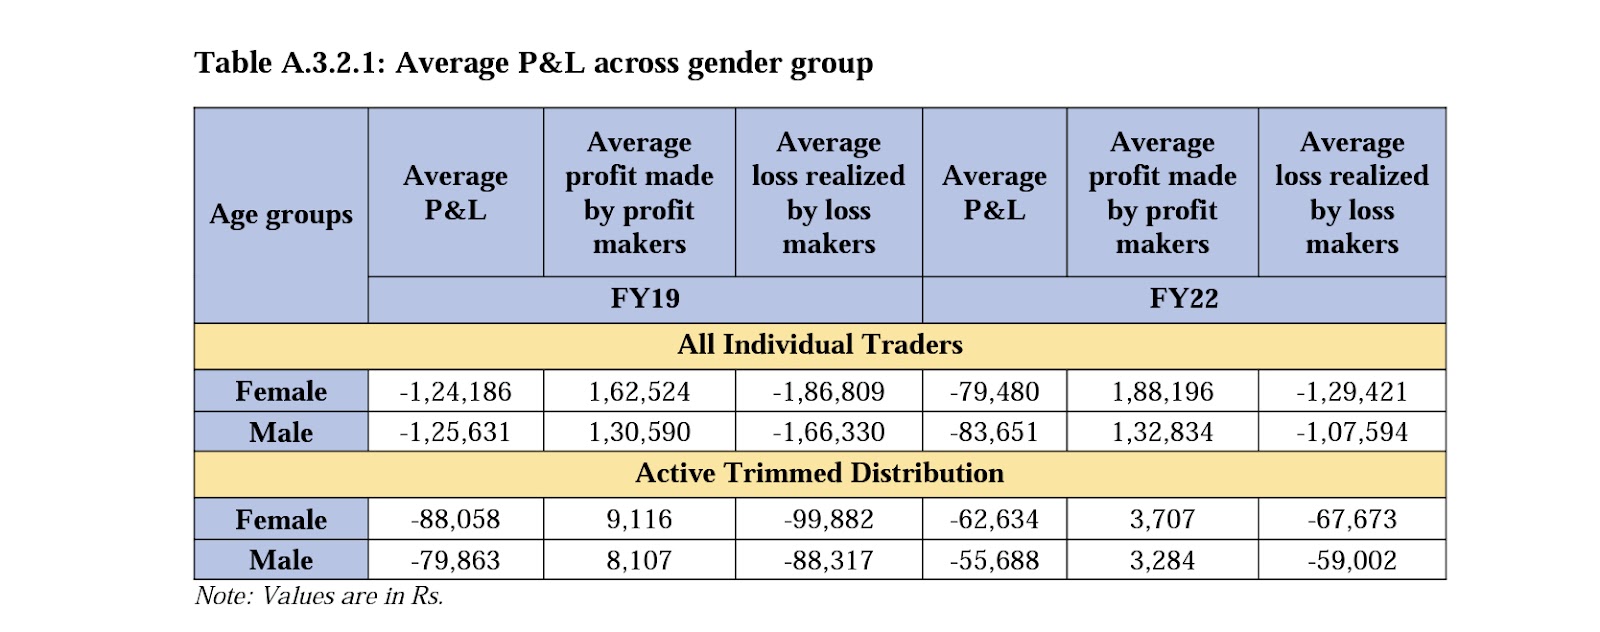
The average profit earned by female profit makers as well as average loss incurred by female loss makers were more than their male counterparts for both FY19 and FY22.
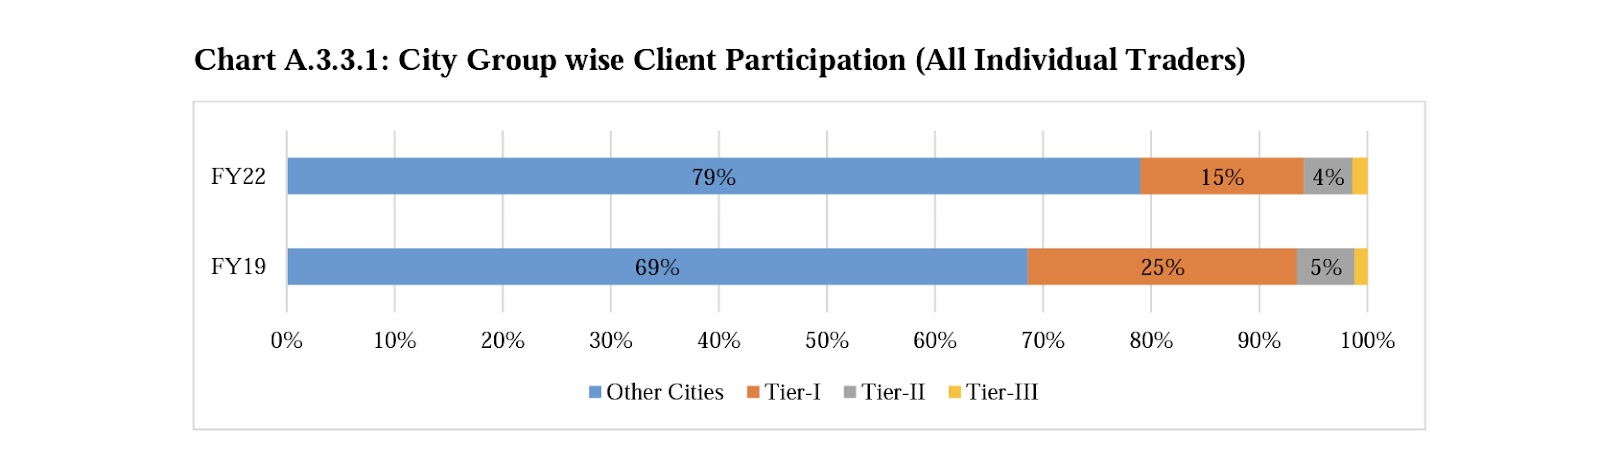
During FY22, the share of individual traders from Tier-I cities went down to 15% from 25%.
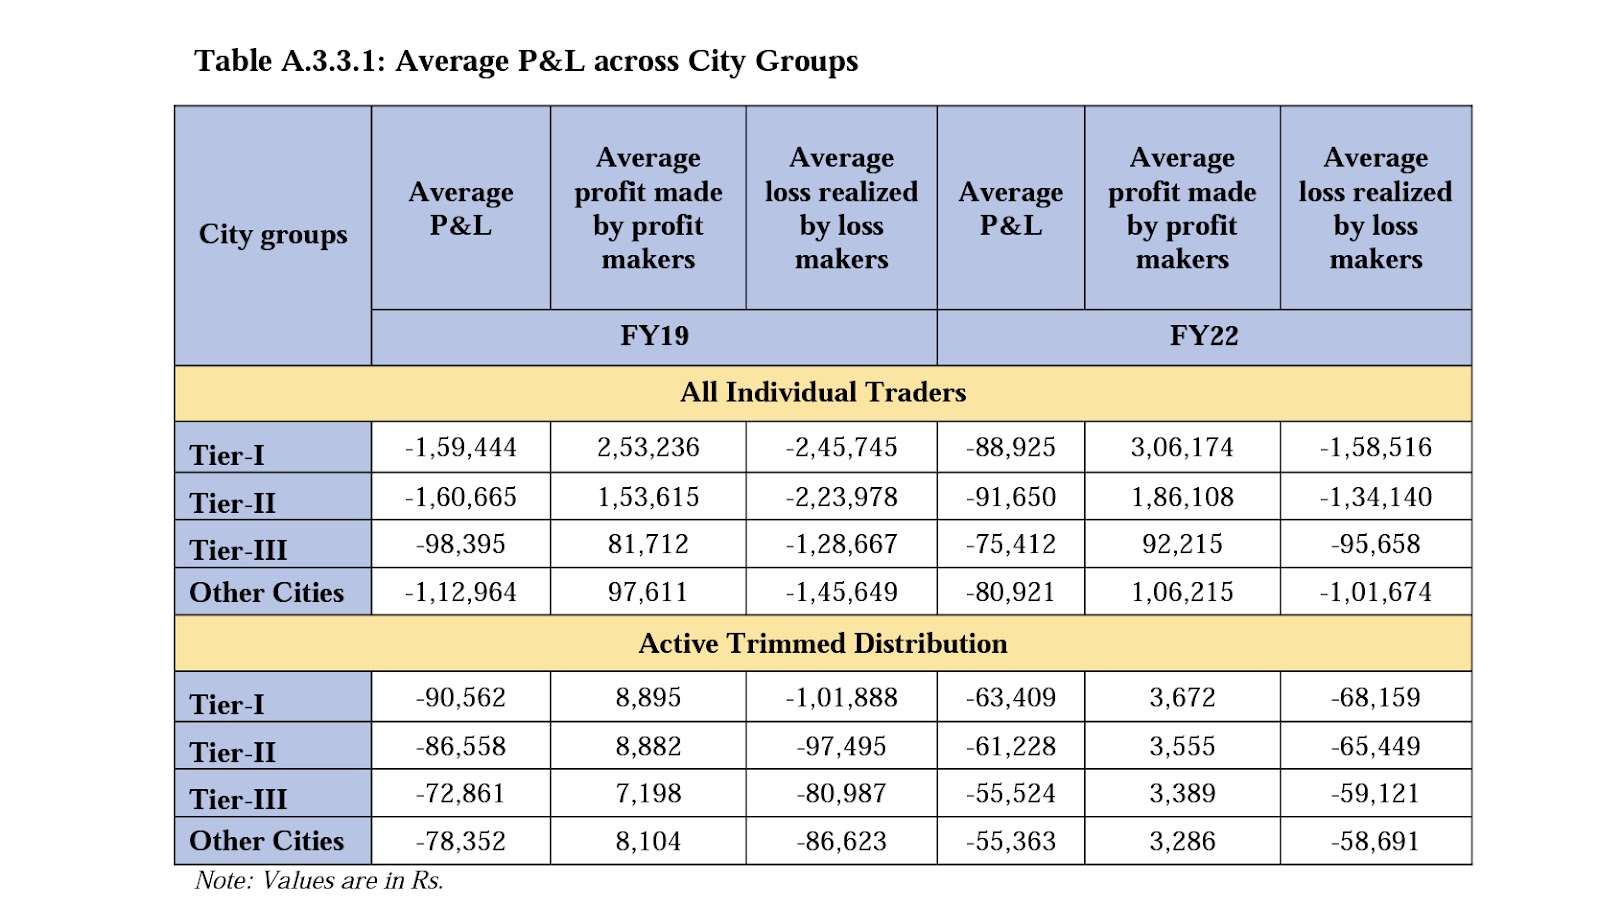
During FY22, the share in profit by profit makers from Tier-I cities was 42% for group of all individual traders as compared to 18% for a group of profit makers in active trimmed cohort. This indicates the concentration of top profit makers (outliers) in Tier-I cities.
During both FY19 and FY22, the highest average profit made by profit makers as well as highest average loss incurred by loss makers was from Tier-I cities.
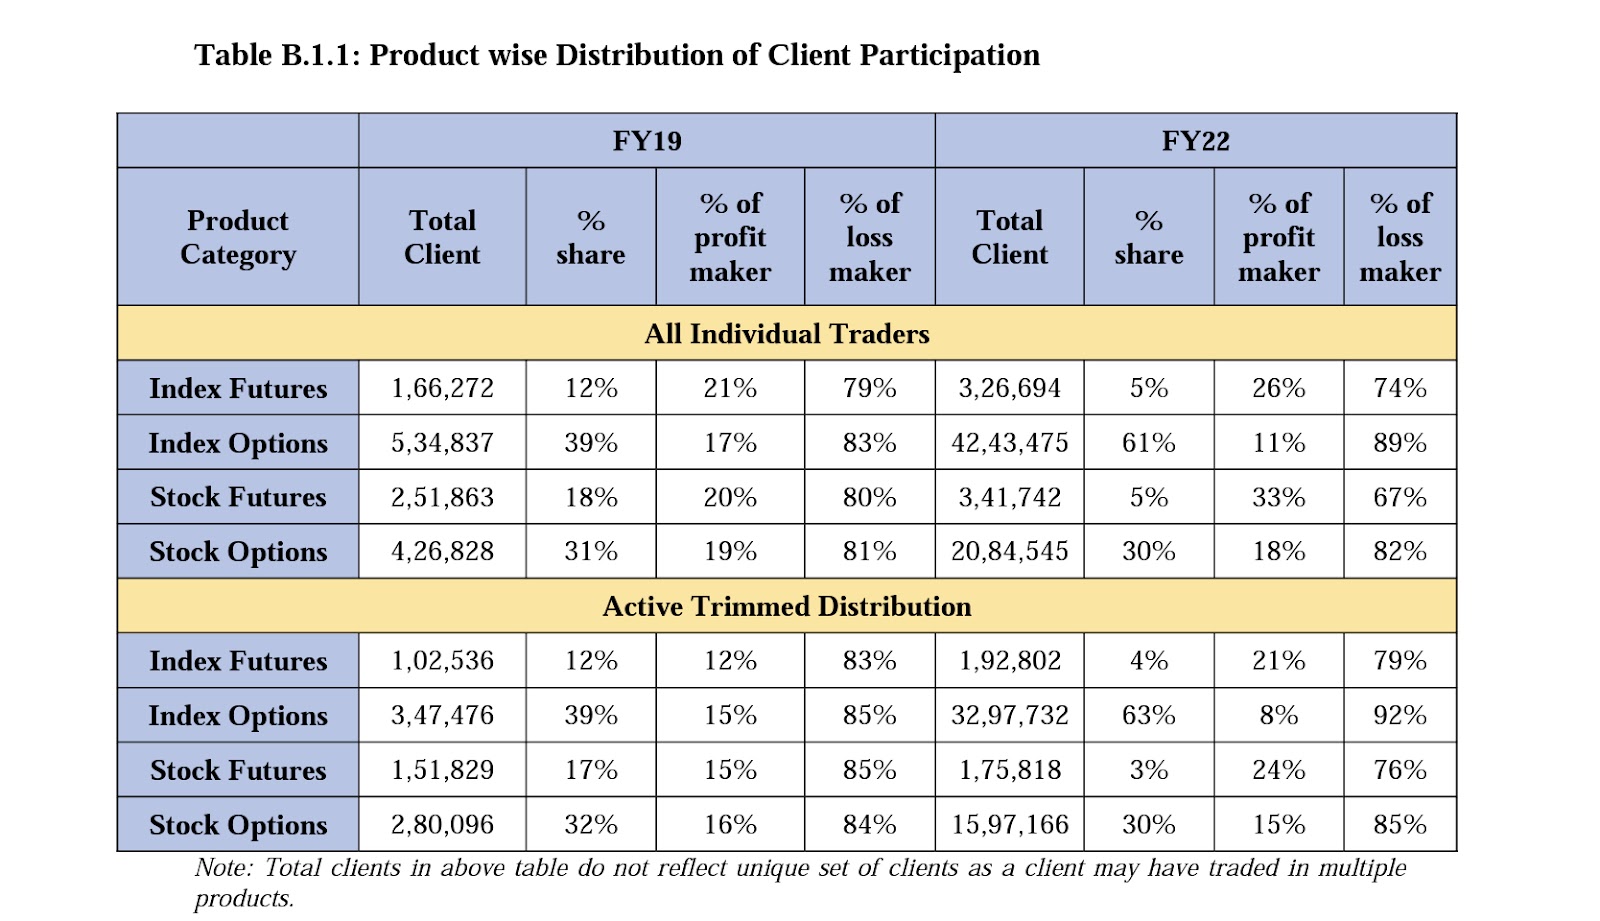
Among all the unique individual traders who traded in equity F&O segment, 98% traded in options, while 11% traded in futures during FY22 as compared to 89% and 43% respectively, during FY19.
No. of individual traders in index options and stock options went up by nearly 8 and 5 times respectively in FY22 as compared to FY19.
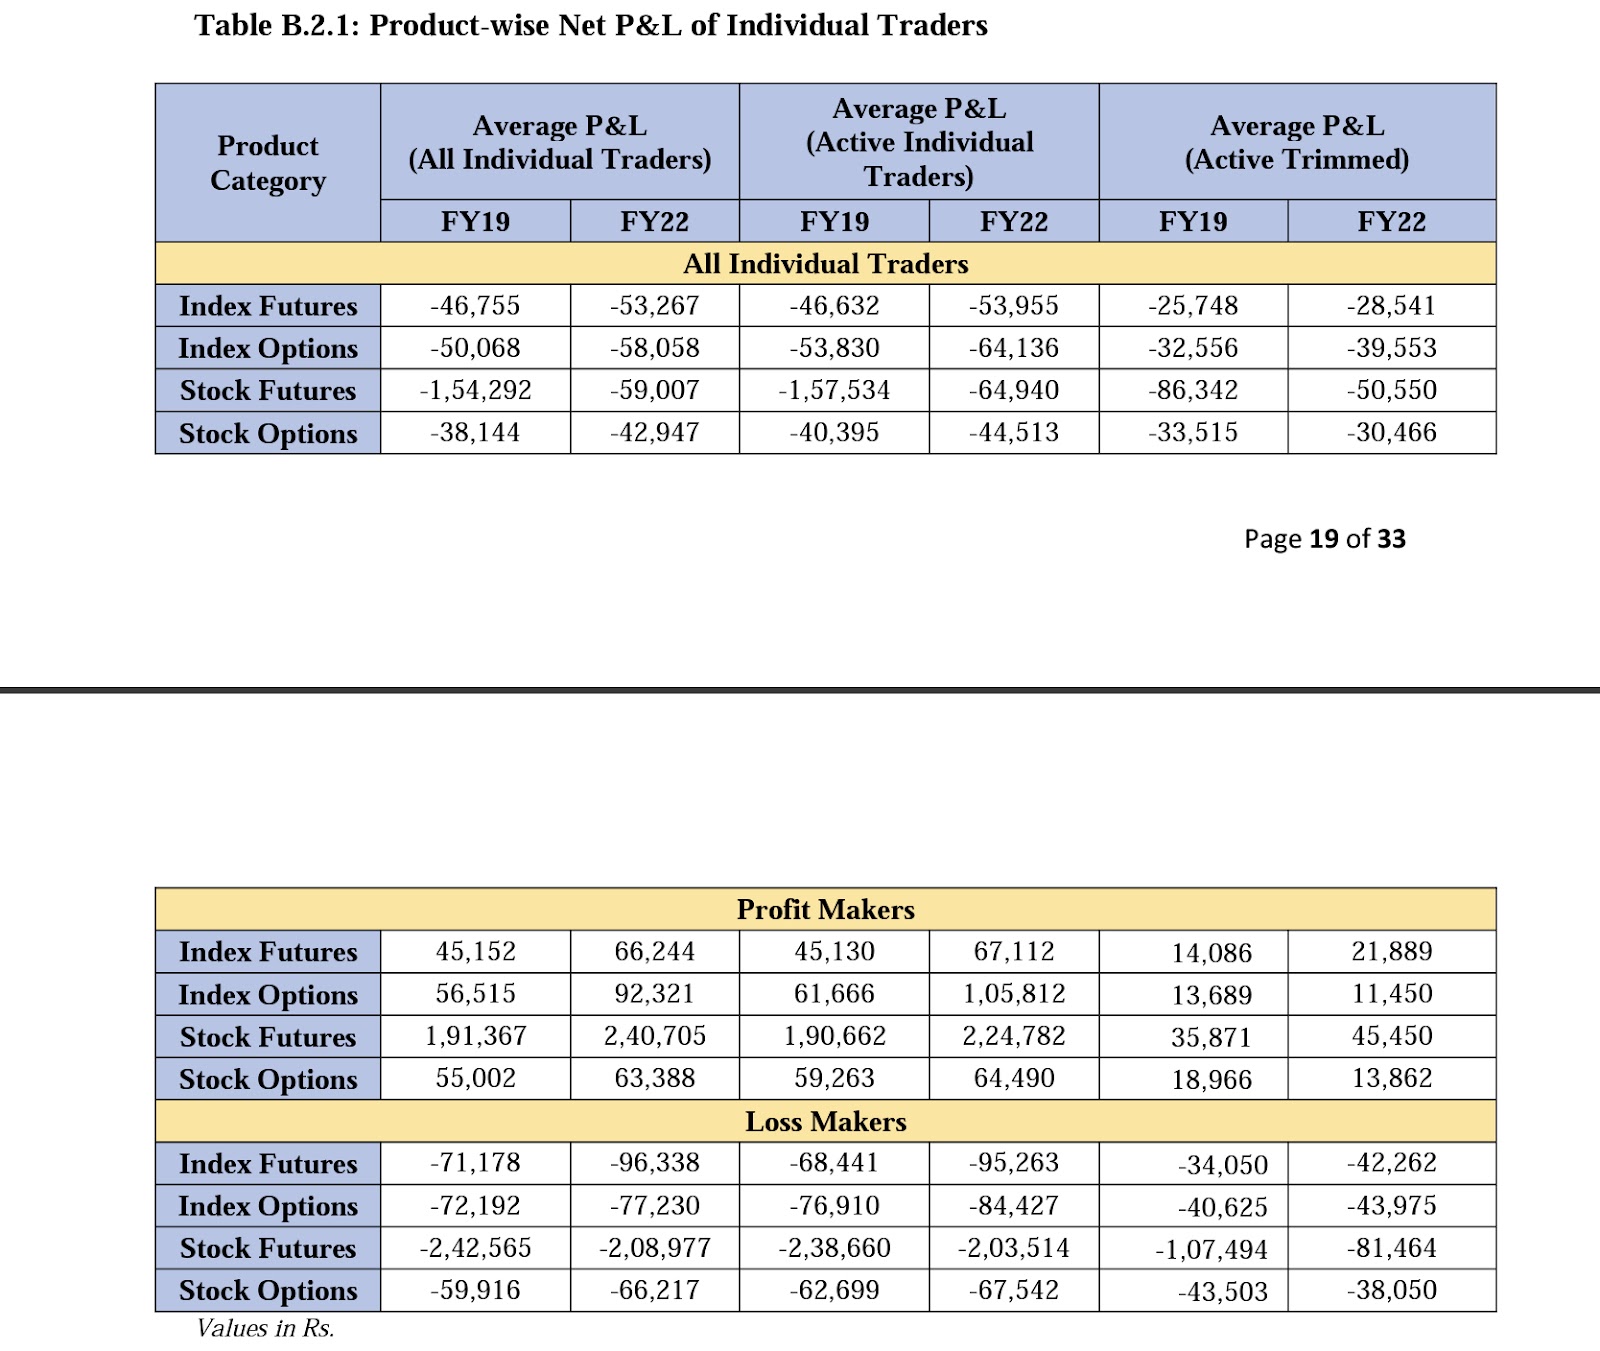
During FY22, the average loss incurred by loss makers in stock futures was Rs. 2.1 lakh, highest across all products, followed by an average loss of Rs. 0.96 lakh in index futures.
While the average loss made by loss makers in index options and stock options were Rs. 0.77 lakh and Rs. 0.66 lakh, respectively during FY22.
The average profit earned by profit makers was highest in stock futures (Rs. 2.4 lakh), followed by index options (Rs. 0.92 lakh).
During FY22, 11% of the individual traders in index options made profit, down from 17% in FY19, however, the average profit made by profit makers went up by 63% during FY22 over FY19.

The share of young individual traders’ (20-30 years) participation in equity F&O segment, especially in index options and stock options, went up beyond 30% each from nearly 11% in FY19.


During FY22, 34% of the profit makers traded in index options belonged to age group 20-30 years, accounting for 21% of the total net profit earned by all profit makers. 26% of the profit makers were from age group >40 years, accounting for 39% of the total net profit earned by all profit makers.


During FY22, female participation in stock futures and index futures went up to 27% and 24% respectively, up from 22% and 22% as compared to FY19.
However, in options segment, the percentage share in participation by female traders went down during FY22 over FY19.
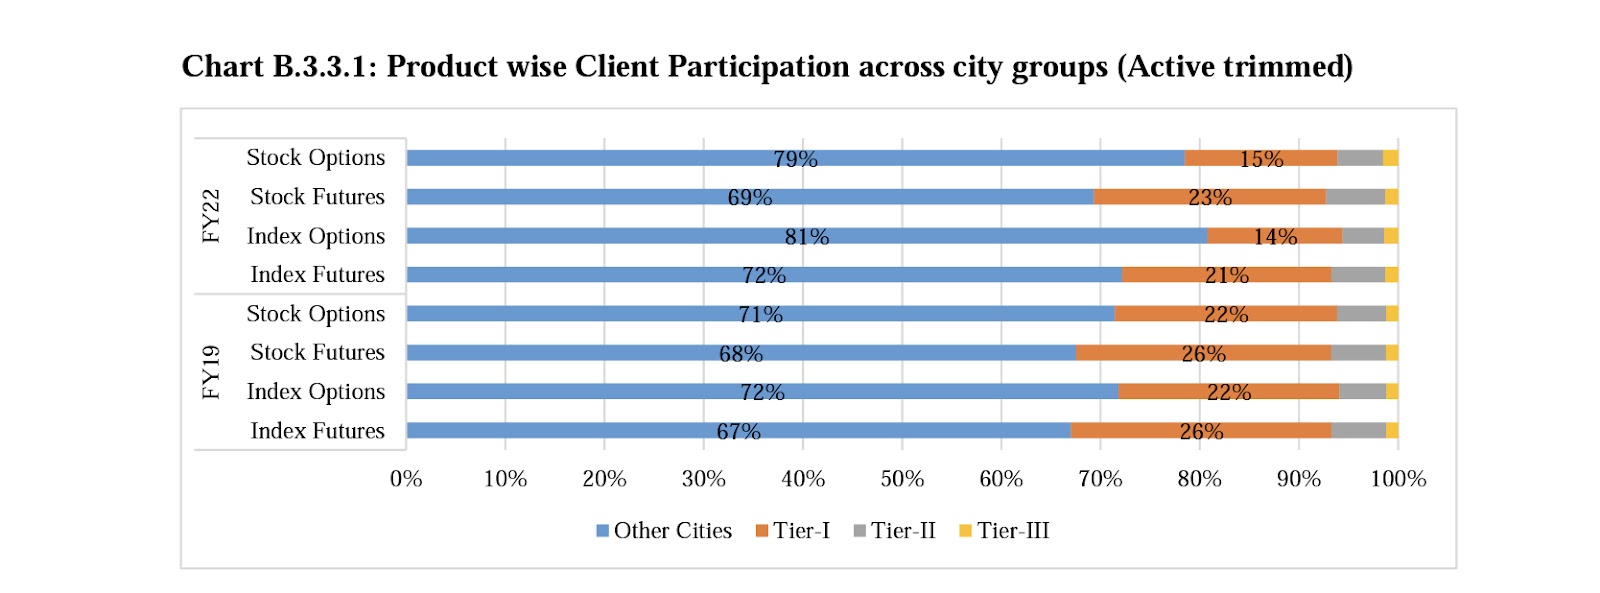
During FY22, the individual traders’ participation in other than Tier-I, Tier-II and TierIII group, went up as compared to FY19, especially in index options.

During FY22, over and above the net trading losses incurred, loss makers expended an additional 28% of net trading losses as transaction costs (for the group of active traders excluding outliers), reflecting frequent trading. For non-active traders who made losses, the percentage was significantly low at 8%.

On a sample of 36.7 lakh individual traders in equity F&O segment during FY22 (and 4.9 lakh individual traders in FY19), the correlation between Portfolio net trading P&L and net trading P&L made in equity F&O segment, stood at 0.84 and 0.80 in FY19 and FY22
Correlation between net trading P&L incurred by individual traders in equity F&O segment and cash segment was 0.06 and -0.07 in FY19 and FY22.
You can check out the detailed report here: