Here are some noteworthy picks from the RBI’s August 2023 bulletin.
Inflation decreased from 7.3% in Q1:2022-23 to 4.6% in Q1:2023-24, driven by waning supply shocks. Monetary policy actions contributed around 130 bps of the decline. Despite a surge in July due to the tomato price shock, core inflation eased. However, ongoing supply shocks, like elevated vegetable prices, could lead to headline inflation averaging over 6% in Q2. Reforms in supply chains are essential to mitigate such shocks and ensure stable prices and farmer earnings.

Global growth in Q2:2023 was hampered by lackluster activity in manufacturing and trade, while the services sector displayed resilience. The effects of monetary policy tightening are now evident in credit and labor market conditions in advanced economies (AEs). Recession probabilities for the US surged to their highest levels in June 2023 since 2021.

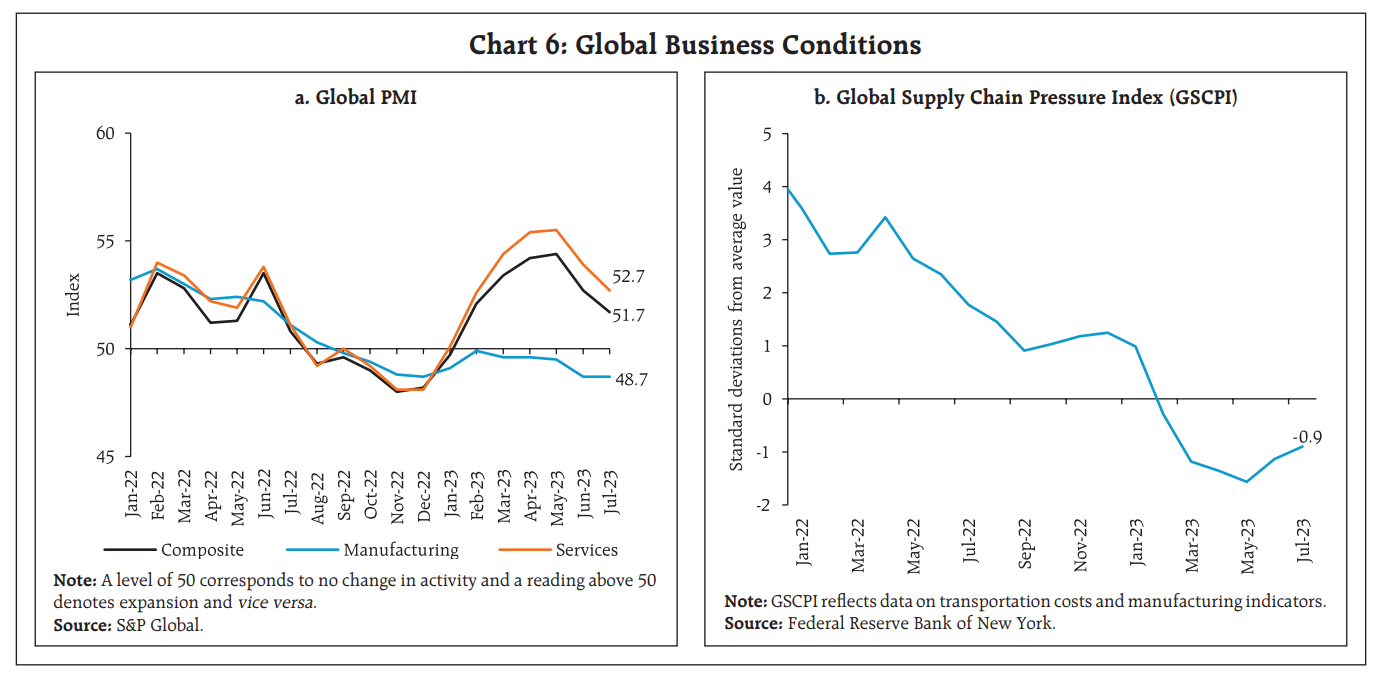
The global composite Purchasing Managers’ Index, a key indicator of worldwide economic activity, reached its lowest level since January 2023. The global services PMI moderated for the second consecutive month, although it remained in the expansionary range. Financial services, except for banks and real estate, showed strong activity. Conversely, the global manufacturing PMI continued its decline in July, with faster drops in output and new orders, especially in the basic materials and construction sector. Despite a sequential improvement in June and July, global supply chain pressures remained below historical averages.
Global commodity prices rose in July, including Brent crude oil reaching $80.1 per barrel due to low US oil stocks and OPEC+ cuts. Gold prices initially increased on weak US job data but later stabilized as the US dollar strengthened. Food grain prices surged after Russia left the Black Sea Grain deal but retreated later. The FAO food price index in July rose by 1.3%, driven by higher vegetable oil prices but offset by declines in sugar, cereals, dairy, and meat prices.

Headline inflation eased in most economies. Euro area inflation hit 5.3% in July, its lowest since Jan 2022. US CPI rose slightly to 3.2% in July. PCE inflation was at 3.0% in June, the lowest since Apr 2021. UK CPI eased to 7.9% in June, and Japan’s CPI rose to 3.3% in June. In EMEs, Brazil and Russia saw higher inflation in July, China had -0.3% deflation, and South Africa’s inflation moderated in June. Core and services inflation show signs of easing but remain above headline in most regions.

Global equity indices rose on optimism for a soft landing due to lower inflation expectations. Bond yields increased following the US Federal Reserve’s rate hike and hawkish stance, and the US yield curve remained inverted. In early August, global stocks fell as the US Treasury announced significant debt issuance, exacerbated by Fitch Ratings’ US downgrade. Yields later softened due to cooling labor market data and Moody’s US bank downgrades.
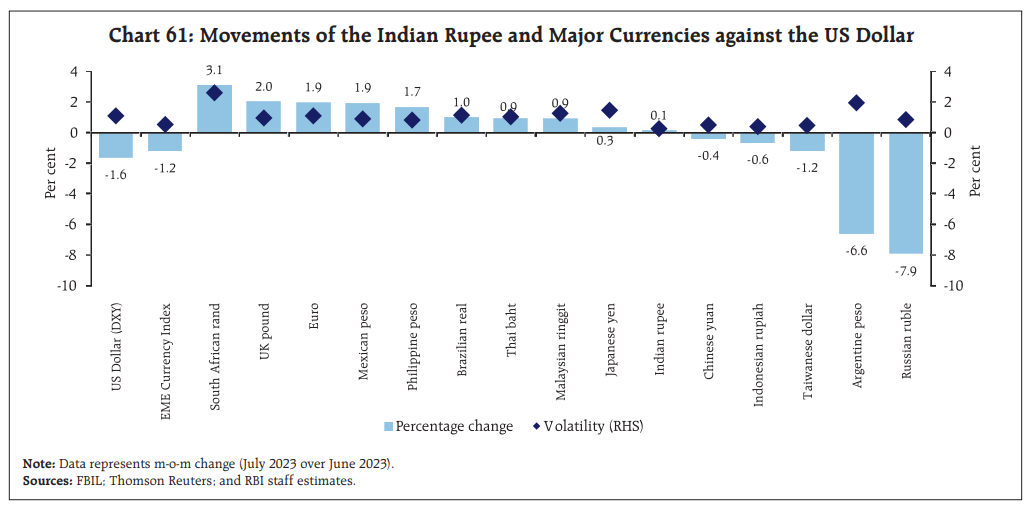
In currency markets, the US dollar initially depreciated but rebounded due to strong US data. In early August, it strengthened on US banking and China economic concerns. The MSCI currency index for EMEs rose in July but fell in early August due to capital outflows.

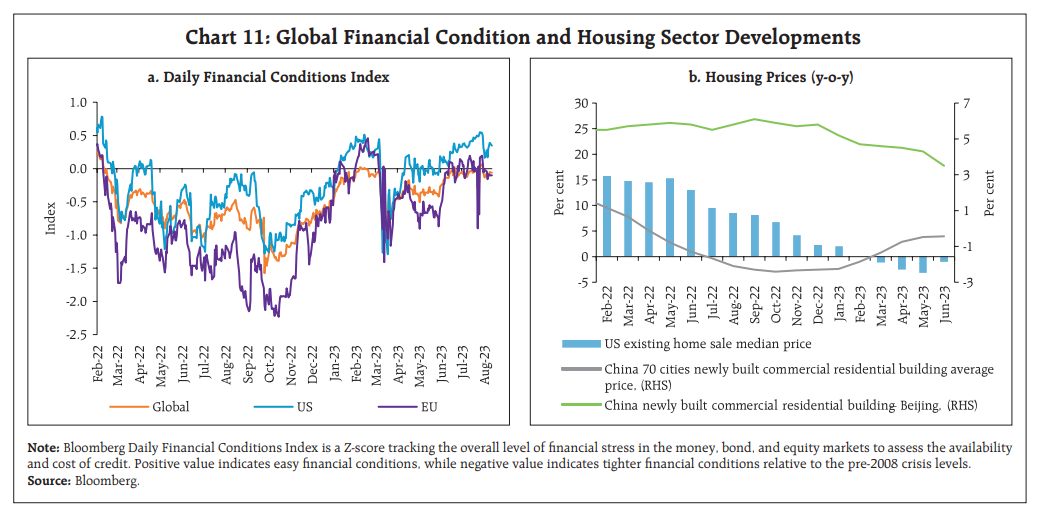
Financial conditions, particularly in the Euro area, have deteriorated due to credit tightening. Global housing market weakness and rising interest rates further worsen these conditions.
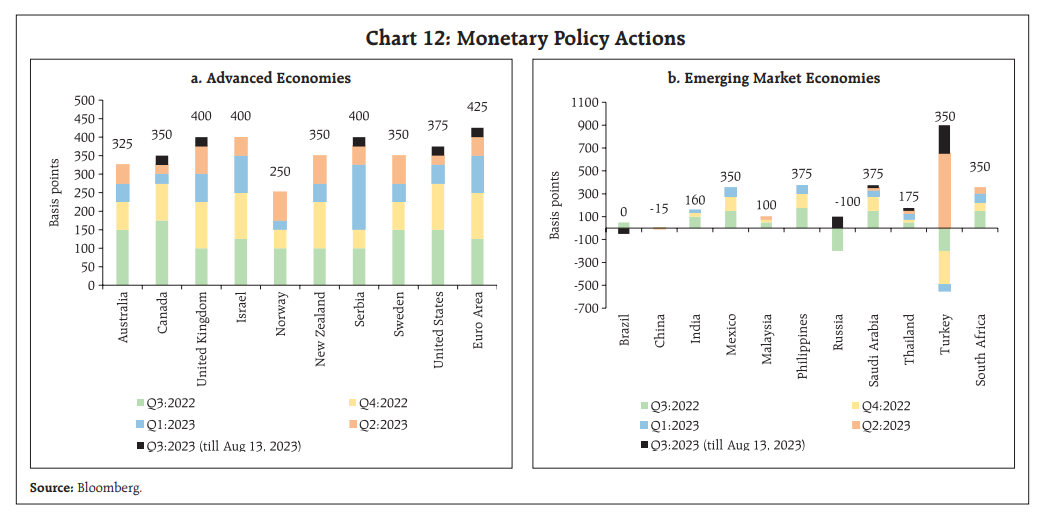
Among major AE central banks, the US FOMC, ECB, and Bank of Canada raised rates by 25 bps each in July. Bank of England increased rates by 25 bps in August. Bank of Japan held a (-) 0.1% rate but adjusted its yield curve control for more flexibility.
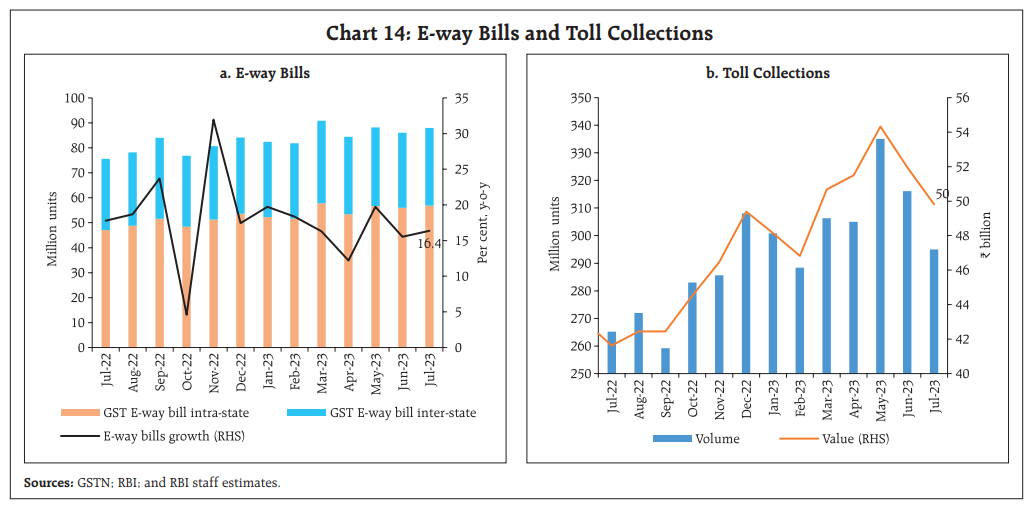
E-way bill volumes showed a July uptick, posting robust double-digit YoY growth, reflecting strong trade activity. Toll collections remained higher YoY but slightly moderated sequentially due to reduced mobility during the southwest monsoon.
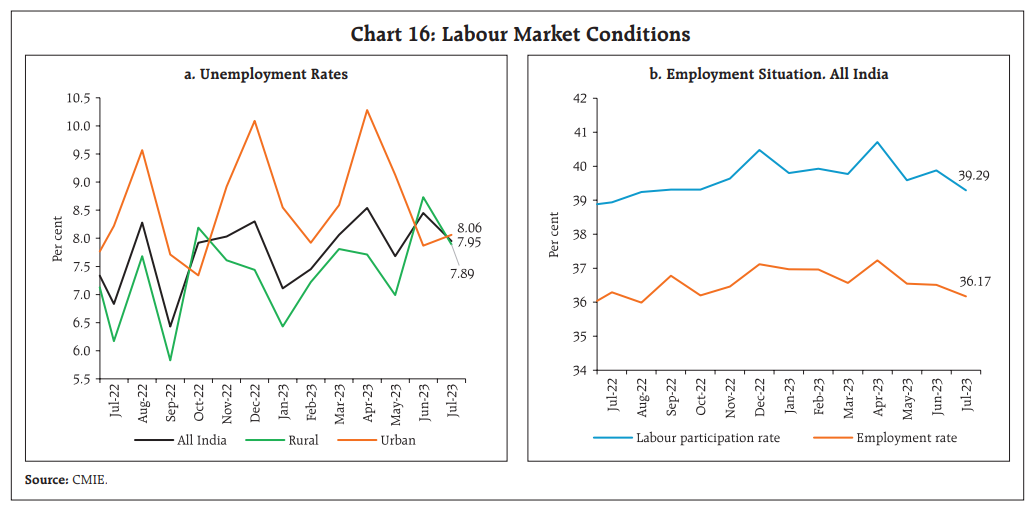
India’s national unemployment rate (UR) dropped to 7.95% in July 2023, primarily due to a lower UR in rural areas. The labor force participation rate and employment rate saw slight declines in July, driven by reduced employment in the services sector.
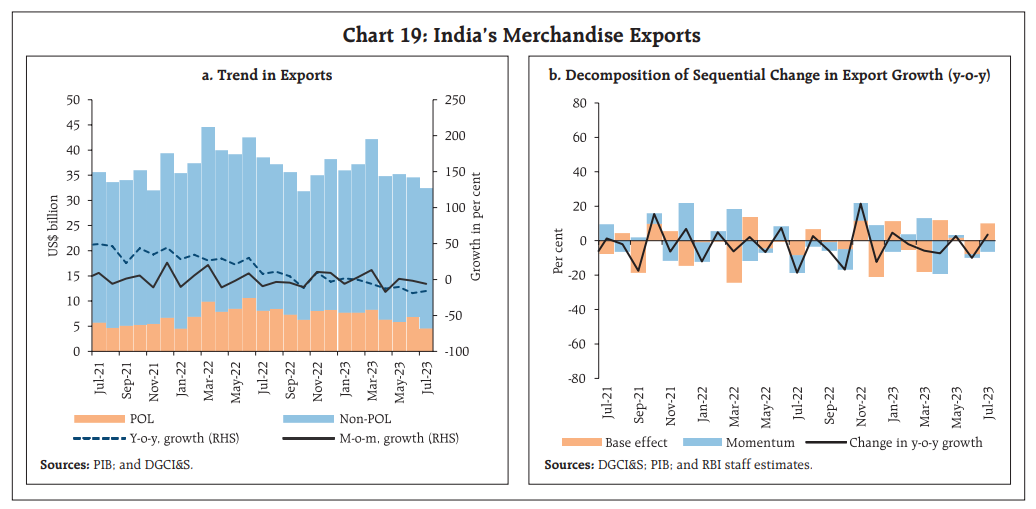
India’s merchandise exports dropped 15.9% YoY for the sixth consecutive month due to negative momentum in July 2023. This decline was widespread, affecting 19 out of 30 major commodities. The main factor behind the contraction was petroleum, which fell to an 18-month low of $4.6 billion, marking a substantial 43.7% YoY decline. Gems, jewelry, and engineering goods also contributed to the decline, while electronic goods, iron ore, ceramic products, glassware, and rice made positive contributions.
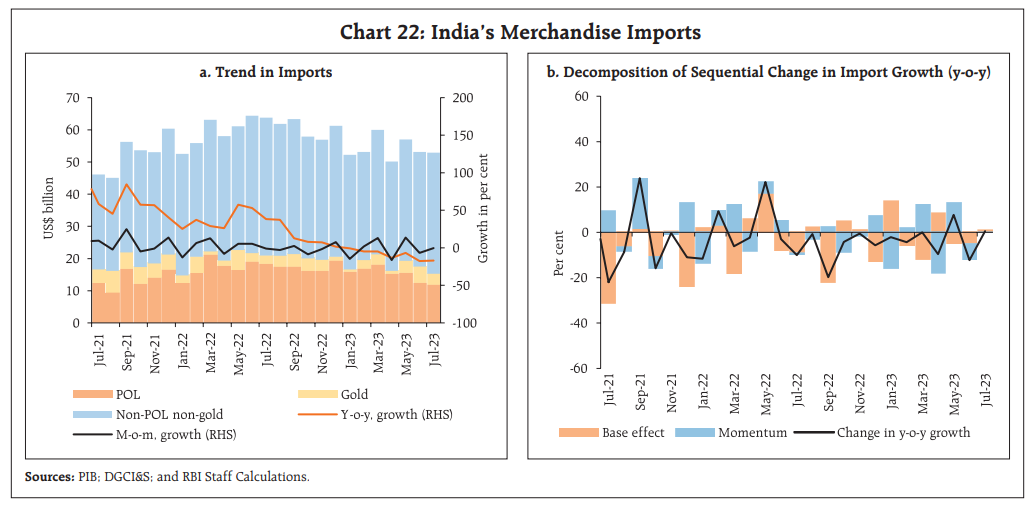
Merchandise imports, totaling US$ 52.9 billion, recorded a 17.0% YoY decline in July 2023, marking the seventh consecutive month of contraction. This downturn was widespread, with 16 out of 30 major commodities in the import basket, accounting for 48%, experiencing YoY declines.
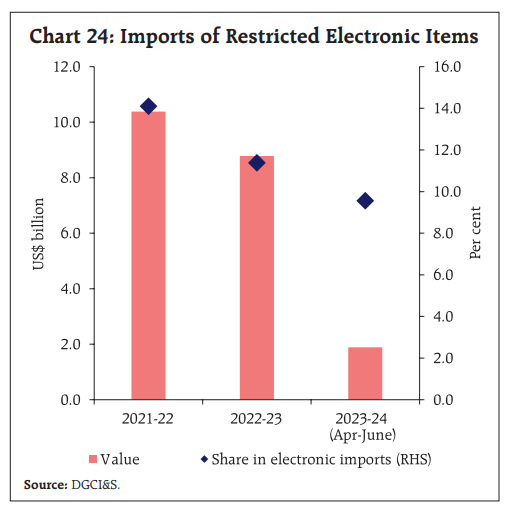
India has introduced licensing requirements for the import of laptops, tablets, all-in-one personal computers, ultra-small computers, and servers, starting from November 1, 2023. These restrictions cover approximately 10% of India’s electronic imports.
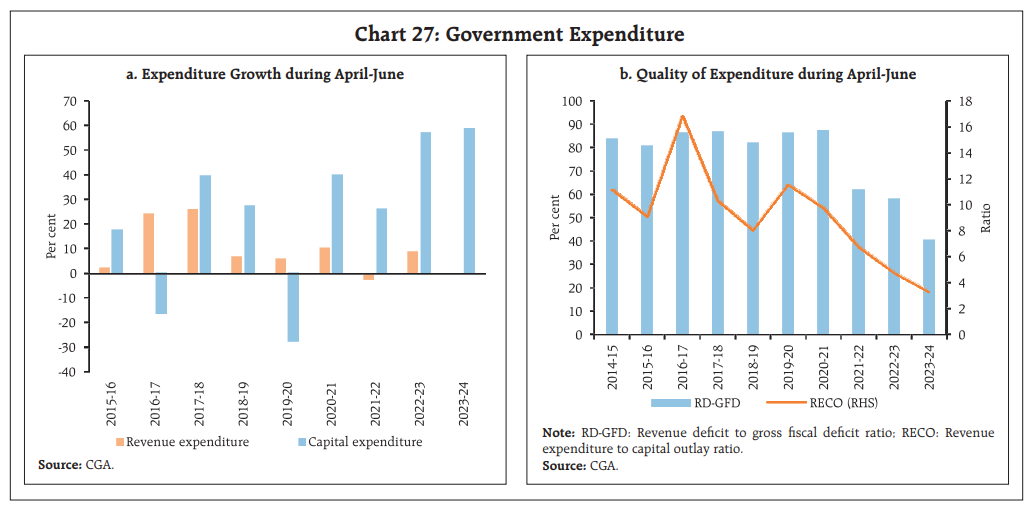
India’s central government gross fiscal deficit (GFD) reached 25.3% of the budget estimates in Q1:2023-24, up from 21.2% in Q1:2022-23. This was driven by a 59.1% YoY increase in capital expenditure, while revenue expenditure remained stable. Total expenditure grew by 10.8%, with capital outlay rising by 45.3%, indicating improved spending quality.
Direct tax collection fell 1.8%, with corporate tax down 13.9%, while income tax grew 11.0%. Indirect tax rose 8.8%, led by GST and customs, countering excise contraction. Gross tax revenue grew 3.3%, but net tax revenue shrank 14.3%, due to increased state devolution. Non-tax revenue surged 149.3%, compensating for weak tax collections, resulting in 0.5% YoY total receipt growth.

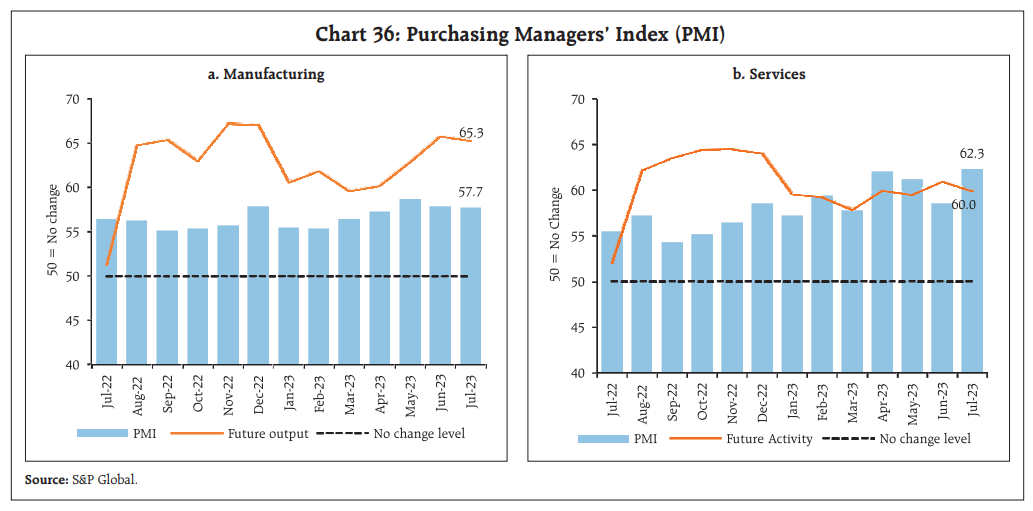
Manufacturing PMI remained slightly down due to lower output, longer supplier times, and reduced purchases, but remains expansionary with strong output prospects. Services PMI surged to a 13-year high, driven by high demand and new business growth.
Transport indicators remained strong in July 2023. Major port cargo traffic showed growth in all categories except thermal coal. Railway freight traffic moderately increased, driven by rises in iron ore and containerized cargo.

Inflation, based on the all-India CPI, jumped to 7.4% in July 2023 from 4.9% in June 2023. This notable rise of approximately 290 bps, a record in the current CPI series, was somewhat countered by a 45 bps base effect. Monthly food prices spiked by 570 bps, fuel by 180 bps, and core inflation (excluding food and fuel) rose by 35 bps.

In Q1:2023-24, net FDI declined due to decreased gross inward FDI and increased repatriation. Over two-thirds of fresh equity flows went to manufacturing, financial and business services, computer services, and energy sectors. Top FDI sources were Singapore, the Netherlands, Japan, the US, and Mauritius.

Indian rupee (INR) gained by 0.1% against the US dollar in July 2023, remaining one of the least volatile currencies among major counterparts.