
Our goal with The Daily Brief is to simplify the biggest stories in the Indian markets and help you understand what they mean. We won’t just tell you what happened, but why and how too. We do this show in both formats: video and audio. This piece curates the stories that we talk about.
You can listen to the podcast on Spotify, Apple Podcasts, or wherever you get your podcasts and videos on YouTube. You can also watch The Daily Brief in Hindi.
In today’s edition of The Daily Brief:
- Hospitals deliver strong results
- What do RBI surveys say about India’s future?
Hospitals deliver strong results
The Q3 results for India’s biggest hospital players are out. Today, we’re looking at two of the biggest names in private healthcare — Apollo Hospitals and Fortis Healthcare. Both had great quarters. They both saw huge jumps in profits, increasing EBITDA margins, better occupancy rates, and more revenue per occupied bed.
If this sounds like Greek and Latin to you, don’t worry. We know we haven’t covered this sector before. So, before we dive into the numbers, we’re going to step back and understand India’s hospital sector. By the end of this, you’ll know how hospitals make money, what drives their profitability, and why some hospitals perform better than others. Let’s dive in.
Where hospitals fit in India’s healthcare sector
The healthcare business falls into three broad categories: primary , secondary , and tertiary care.
Primary care comes at the first point of contact — like your regular doctor, who handles routine illnesses. Secondary care includes local hospitals and nursing homes, which handle more serious medical conditions, but typically don’t perform ultra-complex surgeries.
Tertiary care is where big hospital chains like Apollo and Fortis operate. These offer advanced, multi-specialty treatments like organ transplants or cardiac surgeries. This is where the biggest revenue opportunities exist. These hospitals cater to insured patients, corporate tie-ups, cash-paying individuals, and international medical tourists, all of which can bring in substantial chunks of money. This is the space in which most listed players operate.
How hospitals make money: The OPD vs. IPD dynamic
A hospital is a complex business with multiple revenue streams. One of the most important metrics to consider, however, are their Outpatient Department (OPD) and Inpatient Department (IPD) services.
OPD refers to walk-in consultations, diagnostic tests, and minor treatments — where the patient does not get admitted. IPD patients, on the other hand, are admitted for surgeries, ICU stays, or long-term treatments. They incur bed charges, surgical fees, ICU costs, medical consumables, and pharmacy sales, all of which are high-margin revenue streams. Naturally, the latter generates the most revenue. While OPD accounts for 75-80% of hospital visits, IPD patients contribute 70-80% of hospital revenue.
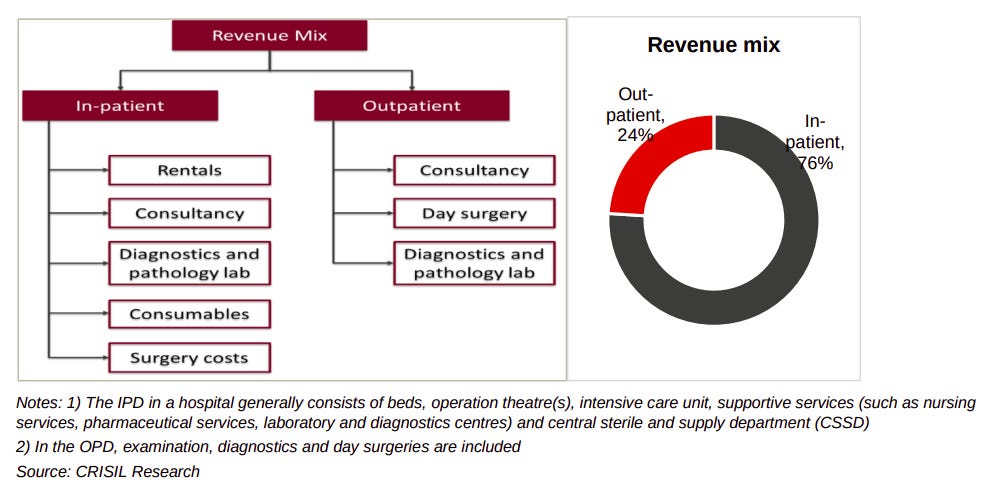
Source: CRISIL
Key Metrics That Investors Look At
Because of how crucial in-patients are to a hospital’s revenue, the most critical metrics, when you’re looking at a hospital, revolve around admitted patients. These directly determine how well a hospital is monetizing its infrastructure. Accordingly, beyond mere revenues, there are specific numbers that people often look at:
-
The Bed Occupancy Rate indicates how well a hospital is using its available beds. Most hospitals in India operate at 60-75% occupancy.
-
The ARPOB (Average Revenue Per Occupied Bed) reflects the hospital’s pricing power. Premium hospitals (like Apollo and Max Healthcare) command ₹40,000-₹50,000 a day, while value-focused hospitals (like Narayana Health) have lower ARPOBs but compensate with higher patient volumes.
-
The ALOS , or Average Length of Stay , looks at how long a patient remains in the hospital. This typically falls between 3-5 days. For profitability, hospitals try and balance fast patient turnover with high-value, complex procedures.
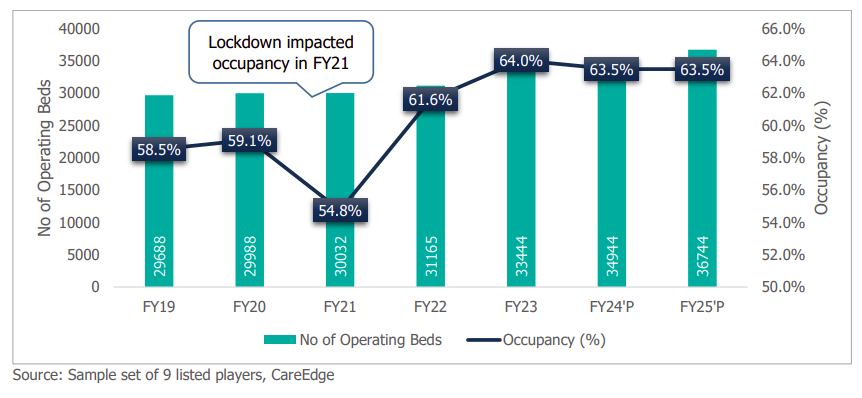
Source: CareEdge Ratings
Beyond this, people generally pay attention to a hospital’s EBITDA margins to understand its operating profitability. Hospitals usually have huge amounts of real estate and a lot of very highly skilled staff — all of which make for extremely high fixed costs. They therefore need strong margins to be sustainable.
Understanding payor mix
Beyond how many patients it treats, a hospital’s revenue depends on who is paying for those treatments. Most of their revenue either comes from self-pay (cash) patients or insurance companies.
Cash patients pay immediately and out-of-pocket, allowing hospitals to charge full market rates. This includes medical tourists, who come for high-end procedures like transplants, robotic surgeries, and complex cardiac treatments. On the other hand, insurance companies tie hospitals down to negotiated rates, lowering margins slightly. They also stretch the timelines at which hospitals receive money. At the same time, they bring steady patient volumes. Therefore, when you’re looking at a hospital’s payor mix, more out-of-pocket customers imply better margins, while a higher share of insured customers points to greater stability.
The remaining revenue comes from government schemes like Ayushman Bharat and corporate tie-ups.
Now that we have a good enough understanding of how the sector works, let’s break down how Apollo and Fortis performed in Q3. These are the top players in Indian healthcare and can give you a good sense of what’s happening. You should know one thing, however: they’re not representative of overall Indian healthcare. Such hospitals cater to an elite clientele in urban India, and the trends you see here might be harder to generalize beyond this group.
Apollo Hospitals
Apollo Hospitals is India’s largest private healthcare provider. Over this quarter, it expanded its dominance with 73 hospitals, with over 10,000 operational beds. Beyond hospitals, however, it has multiple lines of revenue — from pharmacies to diagnostics to telehealth. This ensures that there are multiple touchpoints from which money flows in.
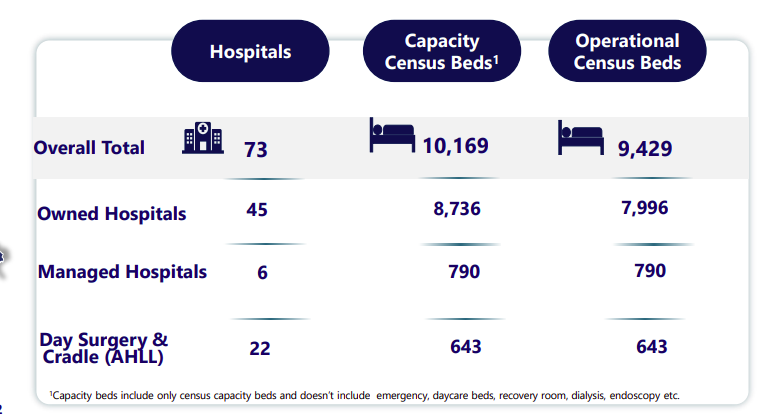
Source: Company’s Investor Presentation
Apollo delivered a strong Q3 FY25. Its revenue stood at around ₹5,527 crore, growing 14% YoY. This growth was broad-based — spanning hospitals, pharmacies, and digital health. But beyond mere growth, Apollo is scaling up, expanding profitably, and making strategic shifts that improve its long-term position.
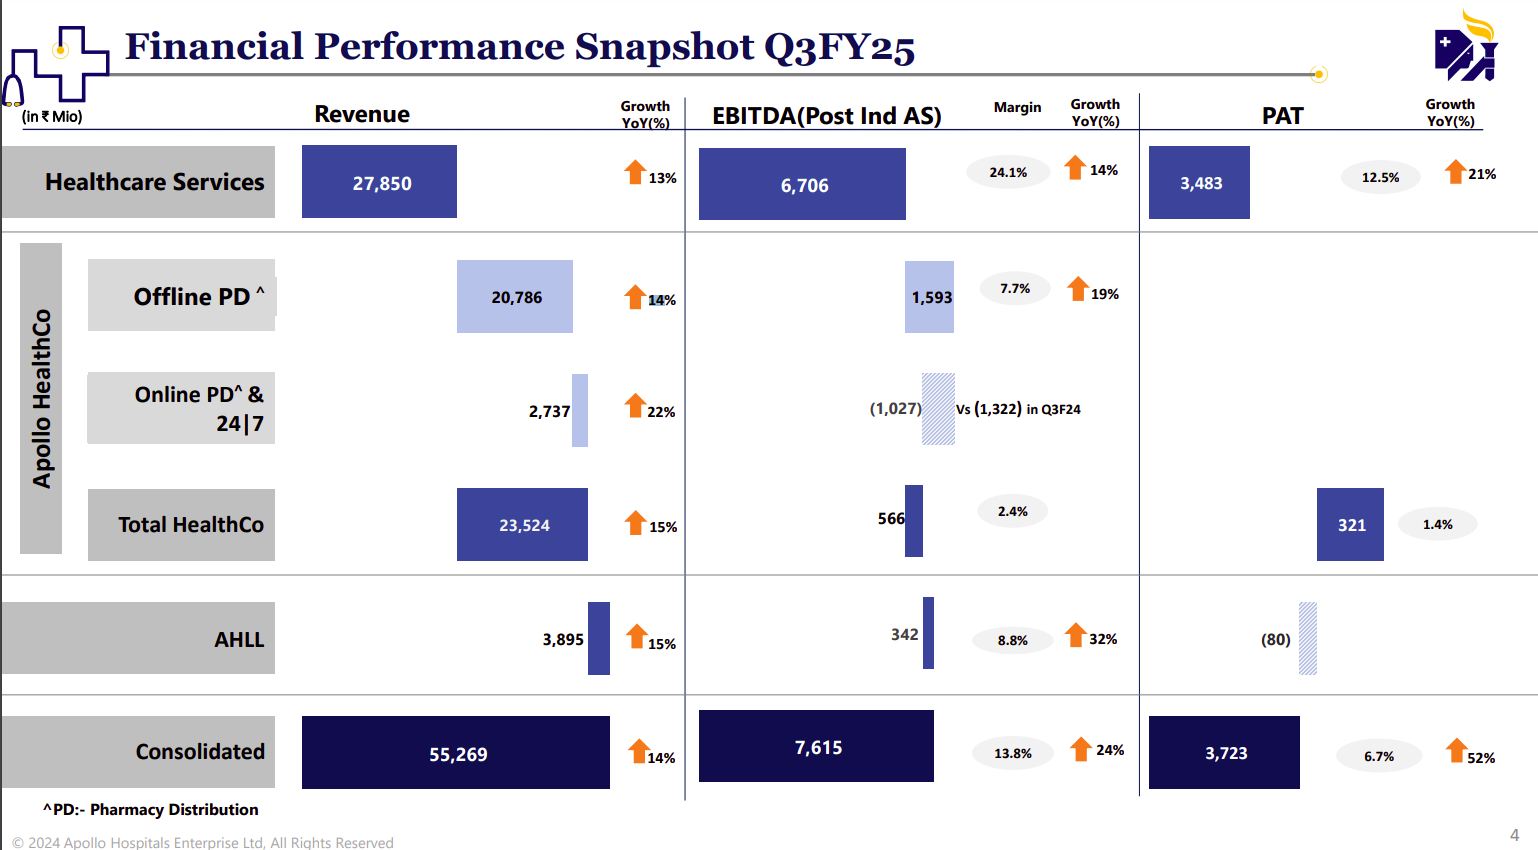
Source: Company’s Investor Presentation
Healthy revenue growth
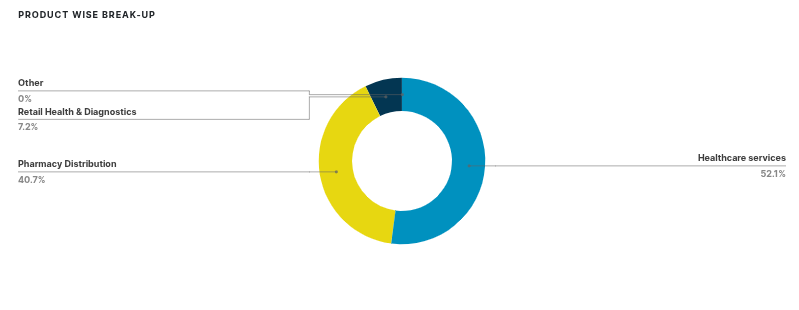
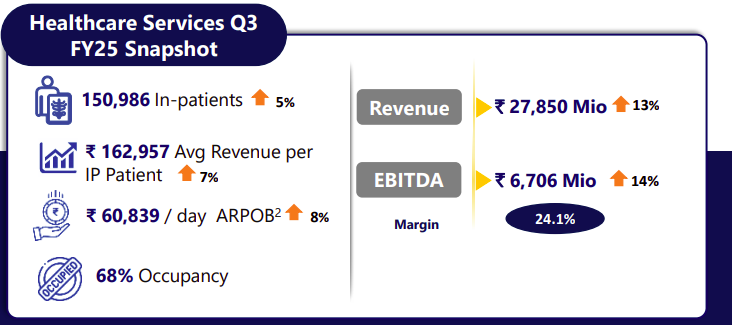
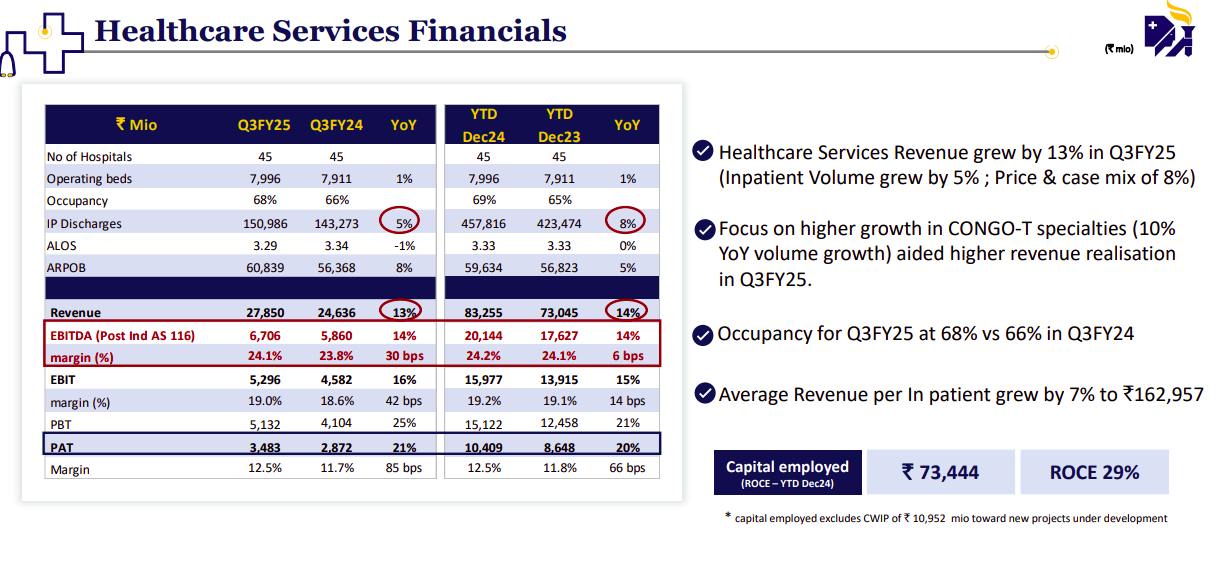
Apollo’s hospital business, which contributes 52% of its revenue, grew 13% YoY to ₹2,785 crore.
Source: Tijori Finance
Higher and more profitable patient admissions drove this increase. The company saw an 8% YoY increase in ARPOB to ₹60,839 per day, and improved bed occupancy, at 68%.
Source: Company’s Investor Presentation
At the same time, its pharmacy and digital health segment grew at 15% YoY, to ₹2,352 crore. The company also rapidly scaled up its ‘Apollo 24|7’ online platform. This was, in fact, the first quarter that Apollo 24|7 turned profitable, contributing ₹32 crore in PAT — compared to a ₹27 crore loss last year.
This is interesting — last year, Apollo sold a major chunk of Apollo 24|7 to the PE firm Advent International, for ₹2,475 crore. This move to profitability is a good sign for Advent.
Better margins, higher profits
Beyond revenues, the company also improved its margins.
Apollo reported better operational efficiency and a more streamlined revenue mix this quarter. As a result, its EBITDA margin expanded to 13.8%, from 12.7% last year.
Source: Company’s Investor Presentation
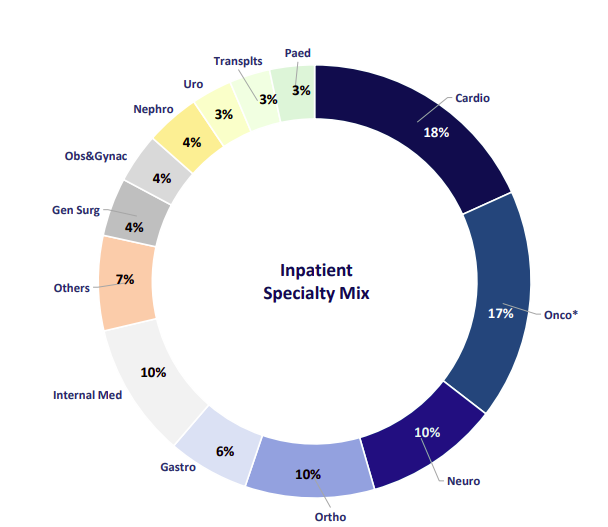
The hospital segment — the most profitable part of the business — maintained a steady EBITDA margin of 24.1%, which is only slightly higher than last year. In particular, the company improved its per-bed revenues — driven by its focus on high-margin specialties such as oncology, neurology, and transplants, as well as a rising share of international patients, who pay premium prices.
Source: Company’s Investor Presentation
The turnaround of Apollo 24|7, meanwhile, sparked a further improvement in its margins. The quarter saw the company cut its losses in this business line and turn a profit instead.
With better margins and more revenue, Apollo’s net profit this quarter surged by a massive 52% YoY — to ₹372 crore, from ₹245 crore last year.
Expansion Plans and Private Equity Involvement
Beyond mere profitability figures, however, Apollo’s aggressive expansion plans are worth taking note of.
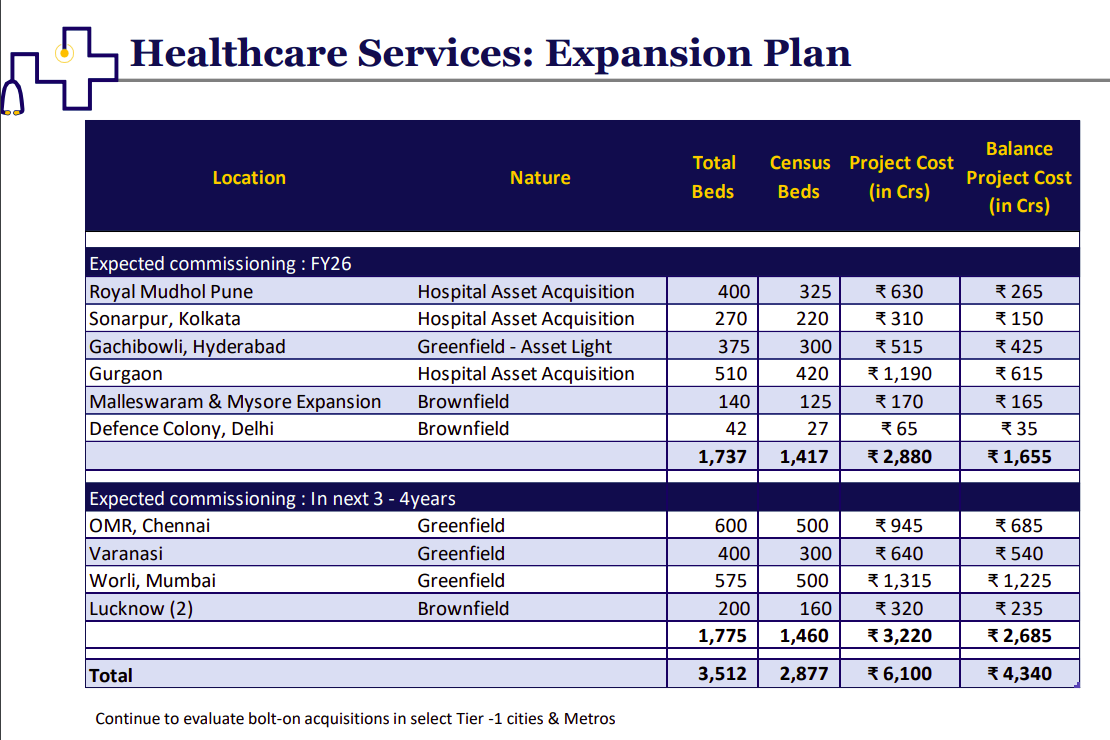
The company is investing ₹6,100 crore to add 3,500+ beds across tier-1 cities like Mumbai, Chennai, Gurgaon, Hyderabad, Lucknow, and Kolkata. A lot of this capital possibly came from Advent International — which paid the company ₹2,475 crore for a stake in Apollo 24|7.
The company’s focus on high-value metro locations is interesting. Unlike smaller hospital chains that expand into Tier-2 cities for volume, Apollo is doubling down on urban centers — where it can charge premium rates for specialized care.
Source: Company’s Investor Presentation
Fortis Healthcare
Fortis Healthcare is another of India’s major private healthcare providers. It operates 27 hospitals with approximately 4,700 operational beds across the country. It was in deep financial distress for many years but has now mounted a strong recovery — after receiving the backing of Malaysia’s health giant, IHH.
While Apollo has diversified into digital health and pharmacy retail, Fortis remains primarily focused on hospitals and diagnostics. 62% of its revenues come from high-margin specialties like oncology, neurology or cardiology. Meanwhile, it has doubled down on its diagnostics business, Agilus Diagnostics, increasing its stake from 57.68% to 89.20%.
Source: Company’s Investor Presentation
Revenue growth
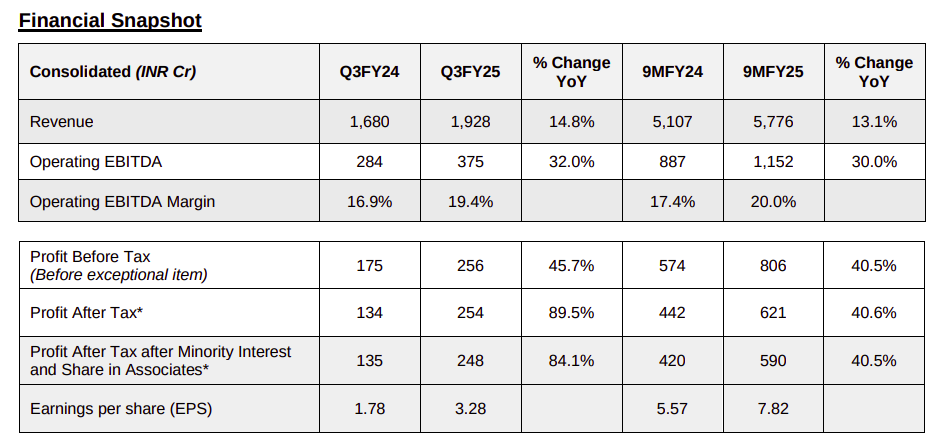
In Q3 FY25, Fortis delivered ₹1,928 crore in total revenue, growing 14.8% YoY.
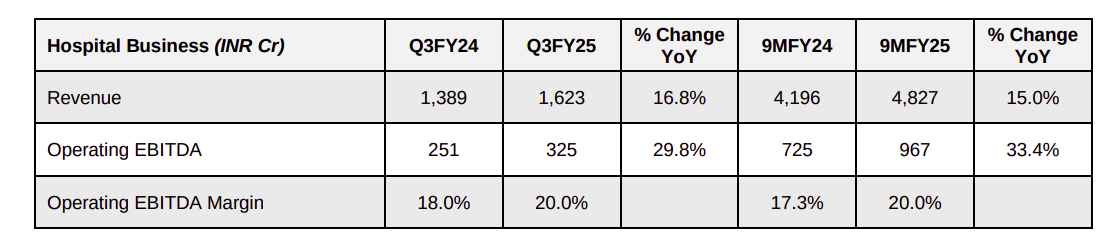
Its hospital business, which accounts for around 84% of its total revenue, grew 16.8% YoY to touch ₹1,623 crore in revenue. This came on the back of more in-patient admissions, along with higher pricing per patient. Its per-bed revenues rose — with ARPOB rising by 9.9%, to ₹2.45 crore per annum. This shows the company’s strong pricing power and its shift towards more high-value treatments. Bed occupancy also improved to 67%, up from 64% last year. The Average Length of Stay (ALOS) improved slightly to 4.20 days.

Source: Company’s Investor Presentation
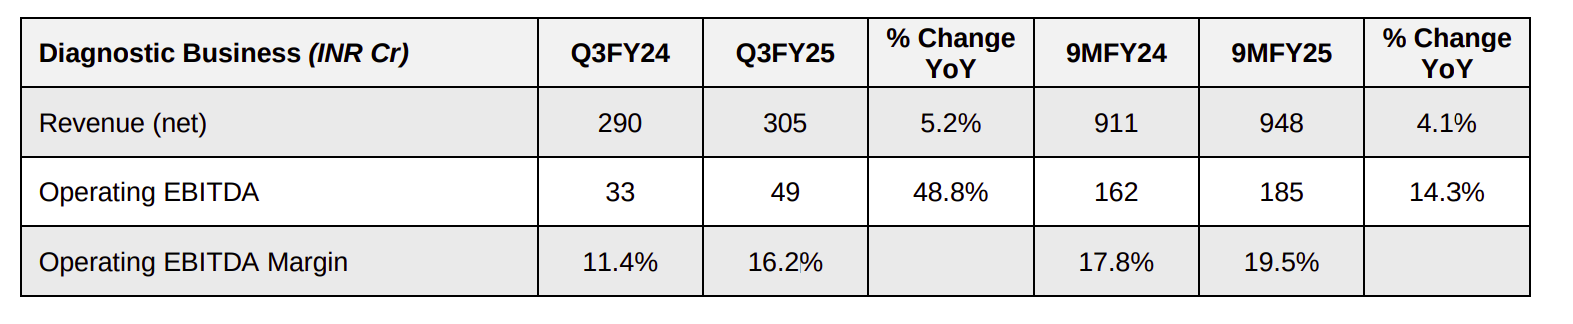
Beyond hospitals, Fortis’ diagnostics business (Agilus Diagnostics) reported ₹305 crore in revenue, growing 5.2% YoY. The company has been busy expanding its diagnostic network, with customer touchpoints in more than 4,126 locations.
Better margins, higher profits
Fortis delivered ₹375 crore in EBITDA, a 32% YoY increase, with margins improving from 16.9% last year to 19.4%.
Source: Company’s Investor Presentation
The hospital segment, its primary revenue contributor, saw EBITDA margins rise to 20.0% from 18.0% — showing improved cost efficiencies and a better revenue mix. These higher margins came from better per-bed revenue, higher occupancy, and better operational efficiencies across hospitals.
Its diagnostics business improved its EBITDA margin as well — to 16.2% from 11.4% last year — showing cost optimizations and more demand for preventive tests.
Source: Company’s Investor Presentation
With higher revenues and better margins, Fortis saw its profits soar. It posted ₹254 crore in net profit (PAT), up 89.5% YoY from ₹134 crore in Q3 FY24.
Streamlining the business
Fortis is currently actively expanding its hospital network. Like Apollo, it is targetting metropolitan areas — with most of its expansion focused on the Delhi-adjacent cities of Faridabad, Manesar, Gurgaon, and Noida:

Source: Company’s Investor Presentation
It isn’t just growing, however. Fortis has also divested underperforming assets in Bangalore and Chennai. Evidently, it isn’t merely expanding—it is shifting its focus to high-growth regions.
What do RBI surveys say about India’s future?
The Reserve Bank of India (RBI) conducts a series of ‘forward-looking surveys’ to understand how people feel about the economy’s future. As the name suggests, these surveys are forward-looking, Instead of recording hard facts, they try to capture people’s opinions and expectations across different areas — from confidence about their employment status to spending habits, to future loan demand.
A couple of days ago, we covered one of these surveys — the ‘Inflation Expectations Survey of Households (IESH).’ Today, we’ll look at all the rest.
Why expectations matter
But before we get into these surveys, you need to know why they are important.
It’s easy to disregard surveys on future expectations. After all, they are subjective — i.e. they simply record people’s opinions and not objective reality. This makes them volatile, imprecise, and often misleading. One day, people’s mood may be upbeat; the next, a single bad headline could send confidence crashing. People argue that sentiments aren’t always rational — they’re shaped by fears, hopes, and the latest buzz. They are, therefore, unconnected to the actual state of the economy.
That’s a fair point, but it also misses something crucial. While economists have spent decades obsessing over numbers, they’ve underplayed the power of narratives. But narratives are important.
Think about it — when an economy slows down, do people run complex economic models in their heads before deciding to cut spending? Of course not. They react to the stories they hear — rumors of layoffs, a viral article predicting a recession, or market pundits who swear the stock market is doomed.
Robert Shiller, the Nobel Prize-winning economist, built a theory around this idea in his paper Narrative Economics . He argued that stories — especially those that tap into emotions and spread like wildfire — don’t just describe economic cycles, but drive them. When narratives catch on, they influence how people spend, invest, and even how governments react. In doing so, they shape the economy itself.

Shiller - Source: Nobel Prize.org
Of course, traders know exactly what this means. For instance, you’ve probably seen a single bearish statement trigger panic market-wide selling, wiping out billions in value — not because of any fundamental collapse, but because enough people feared one was coming. That fear spreads, traders react, and suddenly, the “narrative” of a collapse turns into reality.
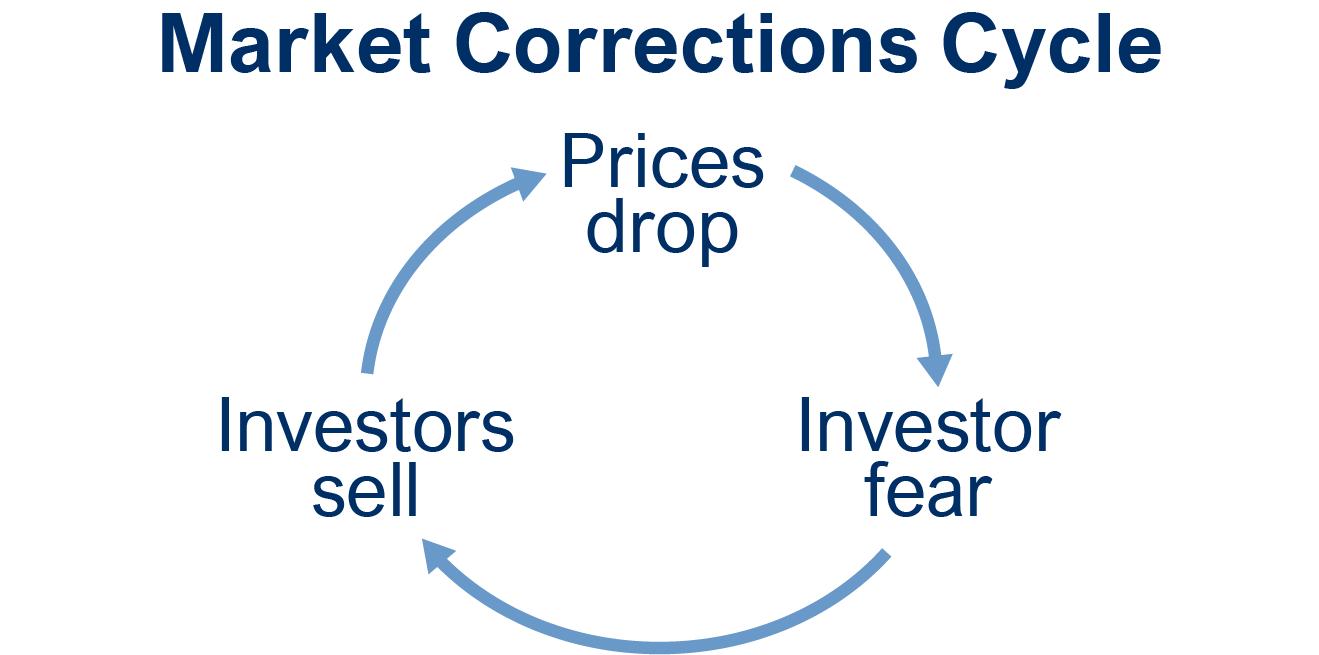
Source: Weitz Investment
Such narratives are exactly what the RBI’s surveys are trying to measure. While these numbers are only vaguely indicative of the objective state of the economy, they capture the dominant economic stories people are telling themselves. If Shiller is right, these narratives shape the economy as much as any hard facts.
What are the surveys saying?
Now before we explain what these surveys reveal about the Indian economy today, let us clarify one thing.
In these surveys, RBI assigns a number to capture public sentiment on a particular aspect of the economy. This number can range from -100 to +100—where positive values reflect optimism, and negative values indicate pessimism.
With that out of the way, let’s start.
1. Consumer Confidence
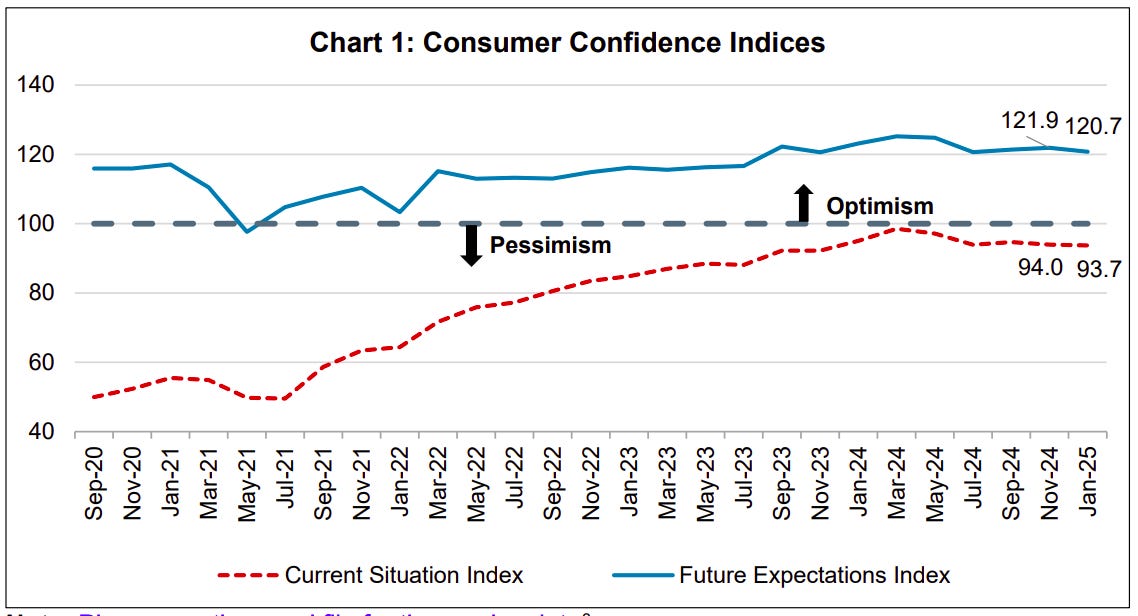
The Consumer Confidence Survey (CCS) helps understand how people feel about the economy — both now and in the near future. It tracks sentiment on jobs, income, inflation, spending, and overall economic conditions. It does so by surveying 6,000+ respondents across 19 major cities.
Overall, the January 2025 edition of the survey reveals that people are a little pessimistic about their current economic situation, although they aren’t panicking just yet.
Source: Consumer Confidence Survey
Source: Consumer Confidence Survey
Diving deeper, here are the key takeaways from the latest data:
-
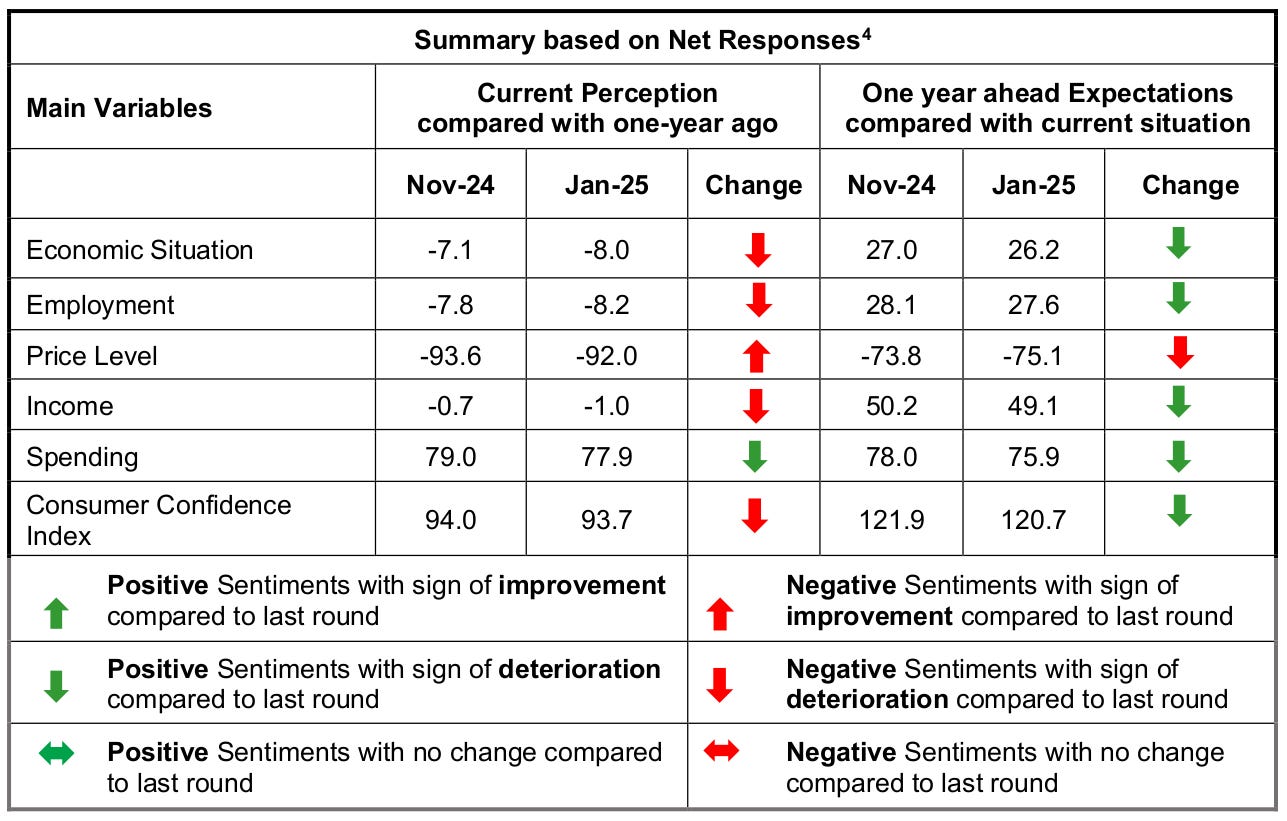
Consumer confidence slightly declined : People feel slightly worse about the economy than before. That said, they still have high expectations for the future — believing that things will improve with time. Their optimism, however, has softened.
-
Employment sentiment weakened: Many respondents feel like employment conditions have deteriorated, while fewer people expect them to improve. Employment sentiment jumped from -7.8 to -8.2.
-
Lower pessimism on price levels, but inflation concerns remain : People have long been concerned about price levels. These concerns have eased slightly, but households still expect inflation to rise in the coming year. This could impact their spending behavior.
-
Spending sentiment declined : Both essential and non-essential spending sentiments dropped in January, compared to November 2024. That is, people are less inclined to spend than they were a few months ago. Future spending expectations still remain positive — that is, people still believe that their spending will go up with time. However, people are becoming more cautious.
-
Income growth expectations dipped: Fewer households feel that their earnings have improved, compared to past periods. There is less certainty about future income gains.
Overall, people have become more cautious about the economy in the last few months. Confidence is dipping, spending sentiment is softening, and income growth expectations aren’t great. When people aren’t sure about their jobs and earnings, they hold on to their money instead of spending it. That’s a problem. Private consumption makes up 60% of India’s GDP — so if people start tightening their purse strings, growth takes a hit. We have clearly seen this play out in the last quarter.
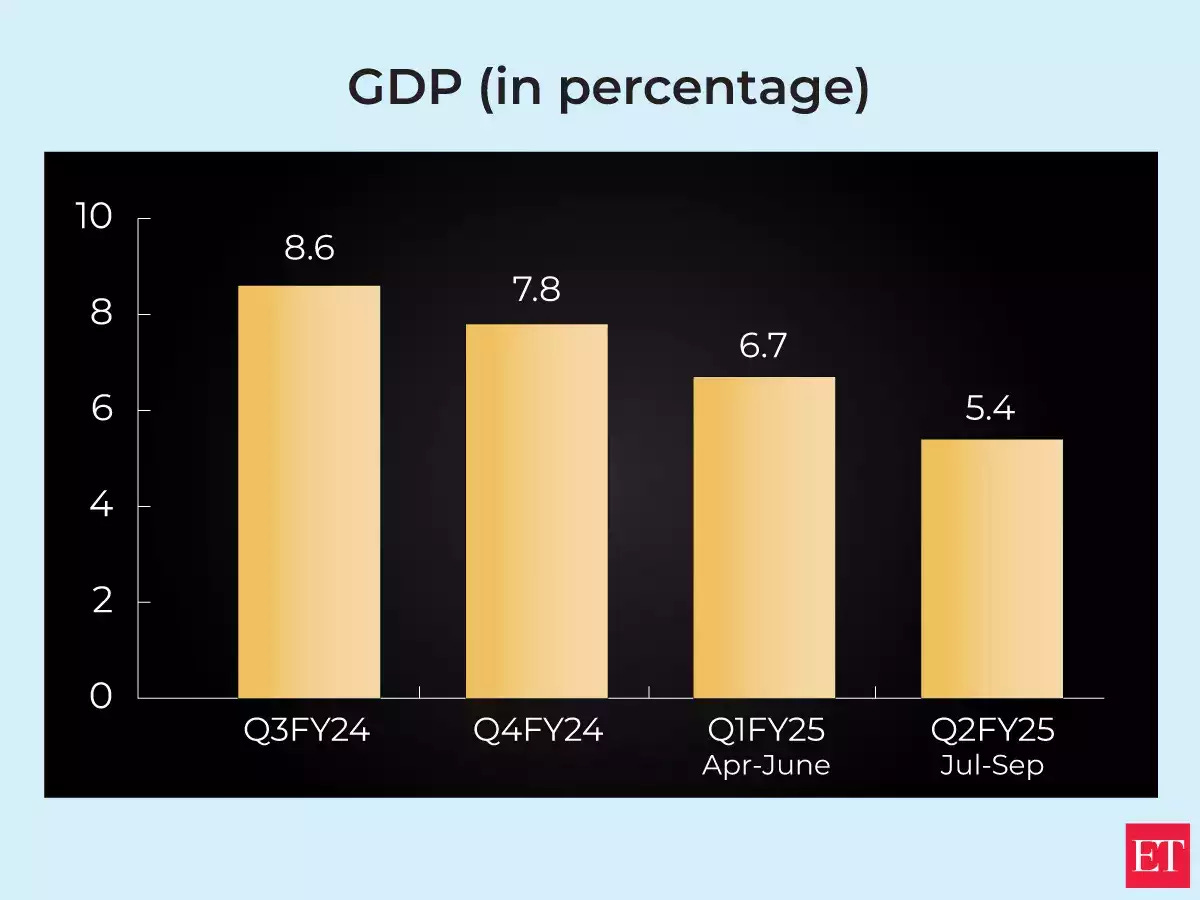
Source: ET
At the same time, inflation expectations are rising. This is what we found in the IESH survey as well. In a perfect world, this should have led RBI to hold off on cutting interest rates. But as growth fell, that option perhaps wasn’t available. We know how that turned out.
The government, for its part, is trying to turn things around. It knows sentiment is shaky, while consumption is down. This is how you should see its recent announcements. A personal income tax cut, followed by a 25 bps repo rate cut? That’s the government saying loud and clear: “We see the problem, and we’re trying to fix it. ”
Now, the big question is: will people’s outlooks actually improve? Or are these merely band-aid solutions? That’s what we’ll be watching in the months ahead.
2. Manufacturing
To understand the state of India’s manufacturing sector, we’ll look at insights from two key RBI surveys—the OBICUS Survey and the Industrial Outlook Survey. While OBICUS focuses on manufacturer’s order books, inventories, and capacity utilization, the Industrial Outlook Survey captures business sentiment, production trends, and cost pressures. Together, they give us a comprehensive picture of manufacturing activity and expectations, based on the responses of 1,000+ manufacturing companies surveyed.
Here are our key takeaways from the latest survey:
- Manufacturing demand is holding up, but growth is slow: Companies reported a slight increase in capacity utilization — that is, they’re working slightly closer to their peak ability. But there isn’t any marked difference, indicating steady but not booming demand.
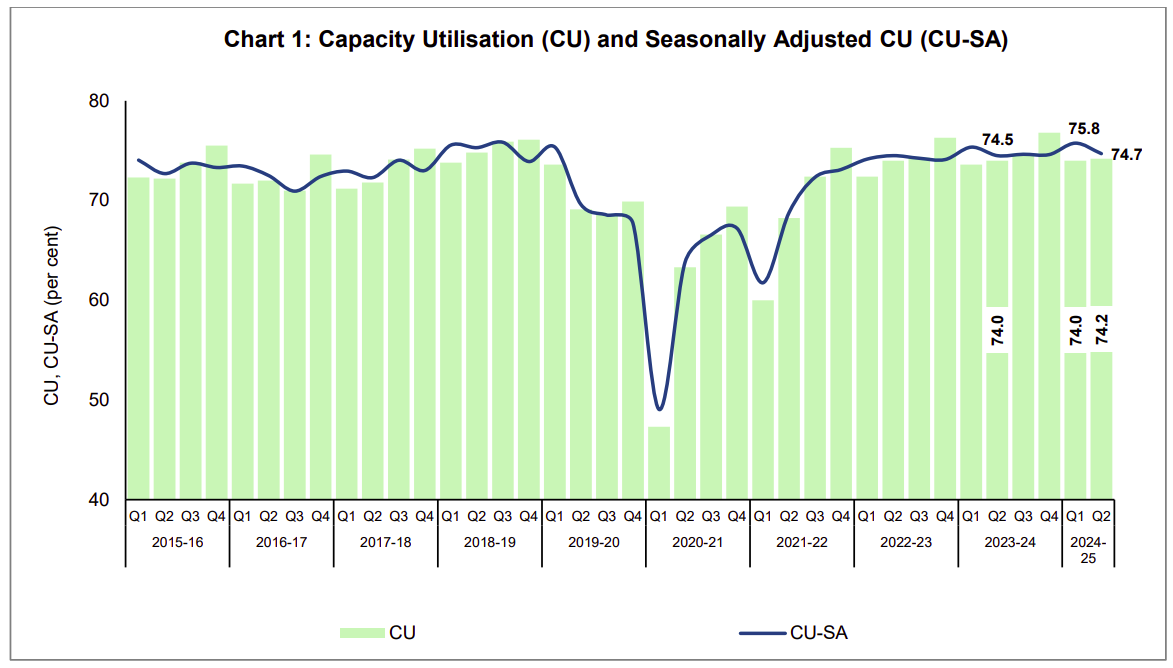
Source: OBICUS Survey
- New orders are growing but at a slower pace than before. While companies saw sequential growth in orders, year-on-year growth has come down, suggesting some slowdown:
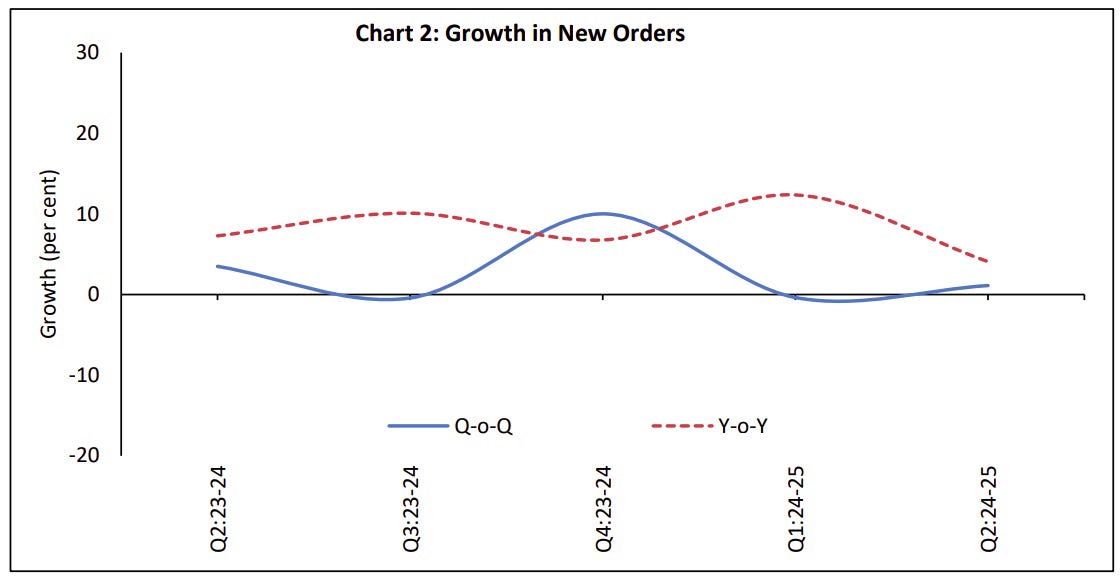
Source: OBICUS Survey
- Inventories remain stable. Manufacturers are not overstocked, meaning they are producing just enough to meet demand. There’s no noticeable ramp-up in their production, however:
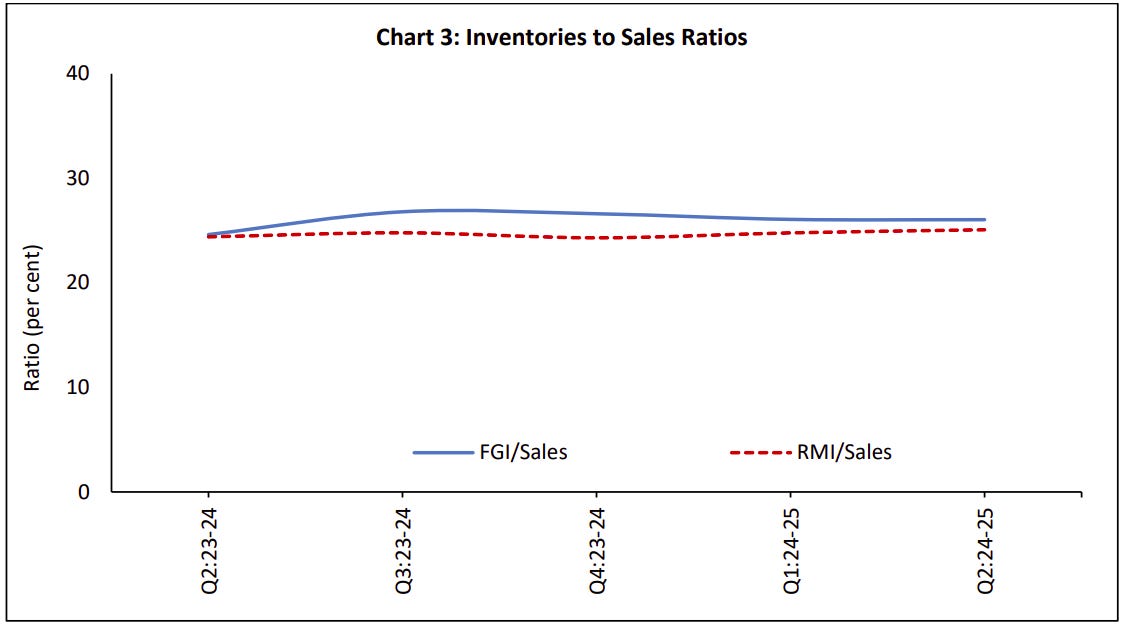
Source: OBICUS Survey
- Input costs are rising, squeezing margins. Companies are struggling with higher raw material costs. While they are passing some of these costs on to customers through price hikes, profit margins remain under pressure. To give you some numbers, the cost of raw materials increased from 38.7 to 46.5 in the last quarter. This is a bad sign. At the same time, selling prices also went up, from 0.2 to 2.6, which means companies are charging more for their products. That said, they aren’t able to pass on the entire increase in their costs. As a result, margins dipped from -10.2 to -12.8.
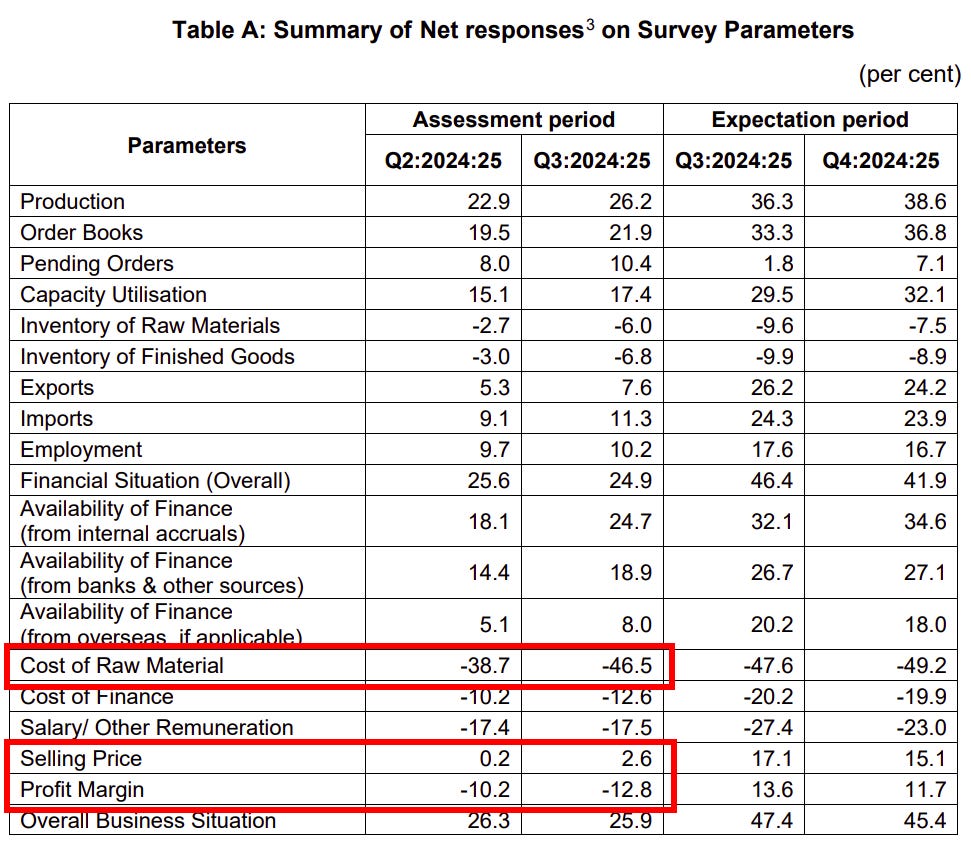
Source: Industrial Outlook Survey
In all, manufacturing is certainly not in a slump. However, it’s not firing on all cylinders either. Demand is steady, but not surging, and rising costs are a growing concern.
If input prices stay high but demand doesn’t pick up significantly, manufacturers might hold back on expansion. Capacity utilization, too, is stagnant, which means that there’s little need, at an aggregate level, for more manufacturing capacity. If this trend continues, India’s decade-long malaise of below-par private investments will carry on, hurting overall economic growth.
3. Bank Lending: What the Survey Reveals
The Bank Lending Survey (BLS) gives us a snapshot of the sentiment of borrowing amongst businesses and individuals. It also looks at whether banks are making it easier or harder to get loans. This survey captures the views of senior loan officers from 30 scheduled commercial banks (i.e. 90% of India’s SCBs), providing insights into credit demand, lending conditions, and future expectations.
Here are the key takeaways from the latest survey:
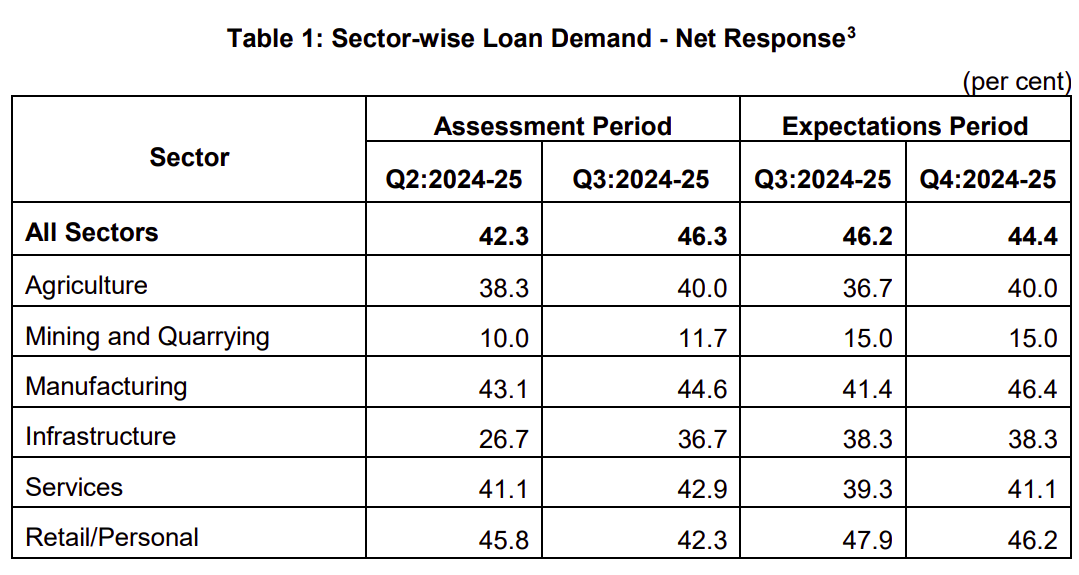
- Loan demand has grown across most sectors, particularly manufacturing, infrastructure, and services. This suggests that businesses are still expanding and investing. On the other hand, retail and personal loan demand has slowed down. You can interpret this in more than one way. For instance, consumers may be more cautious about taking on debt, possibly due to job concerns or rising living costs. At the same time, the RBI has increased risk weights on banks for unsecured consumer loans, making them more expensive for borrowers. As a result, the demand for such loans may have taken a hit.
Source: Bank Lending Survey
- Lending terms remain easy in most sectors, except for mining, where conditions have tightened. It’s possible that banks are seeing higher risks in this sector and are pulling back. Surprisingly, compared to the last quarter, getting a personal loan has become much easier, as terms and conditions have eased — even as the demand for them has taken a hit.

Source: Bank Lending Survey
- Banks expect loan demand to soften slightly in the next quarter, reflecting a temporary dip rather than a long-term slowdown. Credit growth is still intact, meaning businesses have access to funding, but consumer borrowing is slowing down—a trend that could impact spending and economic momentum in the months ahead.
Now, these findings echo the Fortnightly Credit and Deposit Update by Care Edge.
The BLS suggests that loan demand was increasing but showing signs of moderation, especially in retail/personal loans. The Fortnightly Update confirms this trend. Since November, credit growth has slowed from last year’s peak of over 20% growth and now stands at 11.4%. This aligns with banks’ expectations of slower loan demand in upcoming quarters.
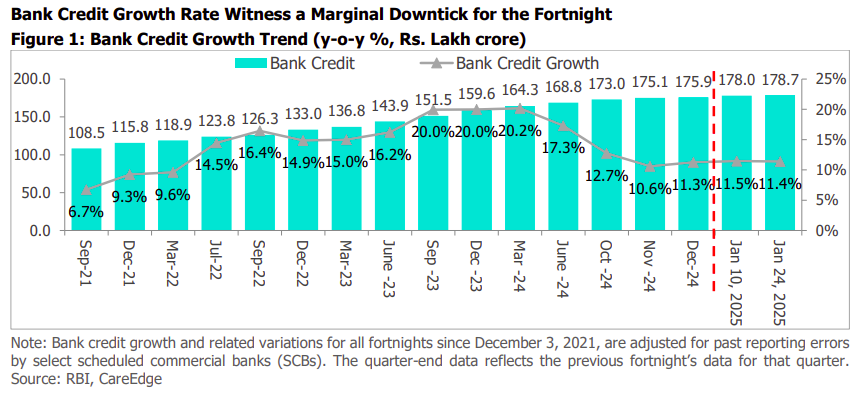
Source: Care Edge
The RBI surveys show that people are getting cautious about the economy. Consumer confidence is dipping, manufacturing is steady but not booming, and businesses are still borrowing, but personal loans are slowing. With inflation worries, growth could slow down, making policy support more important than ever.
Tidbits
- Between April 1 and February 10 of FY25, India’s net direct tax collections rose by 14.7% to ₹17.8 Lakh Cr., driven by a sharp 20.9% growth in non-corporate tax collections, totaling ₹9.4 Lakh Cr. Corporate tax collections grew at a slower pace of 6.1%, reaching ₹7.8 Lakh Cr. Securities Transaction Tax (STT) saw a notable spike of 65.05%, amounting to ₹49,201 crore, reflecting heightened stock market activity.
- Lam Research, a leading U.S. semiconductor equipment manufacturer, is set to invest over $1.2 bn in Karnataka, marking a significant step in India’s semiconductor ambitions. The MoU signed with the Karnataka Industrial Area Development Board is part of India’s larger $10 billion incentive package aimed at building a robust semiconductor ecosystem. The Indian semiconductor market is projected to touch $63 billion by 2026, and Lam’s entry will accelerate this growth.
- Gold leasing rates in India have doubled within a month, reaching record levels as global supply tightens. Typically ranging between 1.5% to 3%, these rates have surged well beyond the norm, significantly increasing costs for jewellers like Titan, Kalyan Jewellers, and Tribhovandas Bhimji Zaveri. The surge stems from global bullion banks diverting gold to the U.S., where futures trade at a $28 per ounce premium over spot prices.
- This edition of the newsletter was written by Krishna and Kashish
 Have you checked out One Thing We Learned?
It’s a new side-project by our writing team, and even if we say so ourselves, it’s fascinating in a weird but wonderful way. Every day, we chase a random fascination of ours and write about it. That’s all. It’s chaotic, it’s unpolished - but it’s honest.
So far, we’ve written about everything from India’s state capacity to bathroom singing to protein, to Russian Gulags, to whether AI will kill us all. Check it out if you’re looking for a fascinating new rabbit hole to go down!
Subscribe to Aftermarket Report, a newsletter where we do a quick daily wrap-up of what happened in the markets—both in India and globally.
Thank you for reading. Do share this with your friends and make them as smart as you are ![]() Join the discussion on today’s edition here.
Join the discussion on today’s edition here.