Can someone explain how to check the support and resistance levels of stocks in Kite.
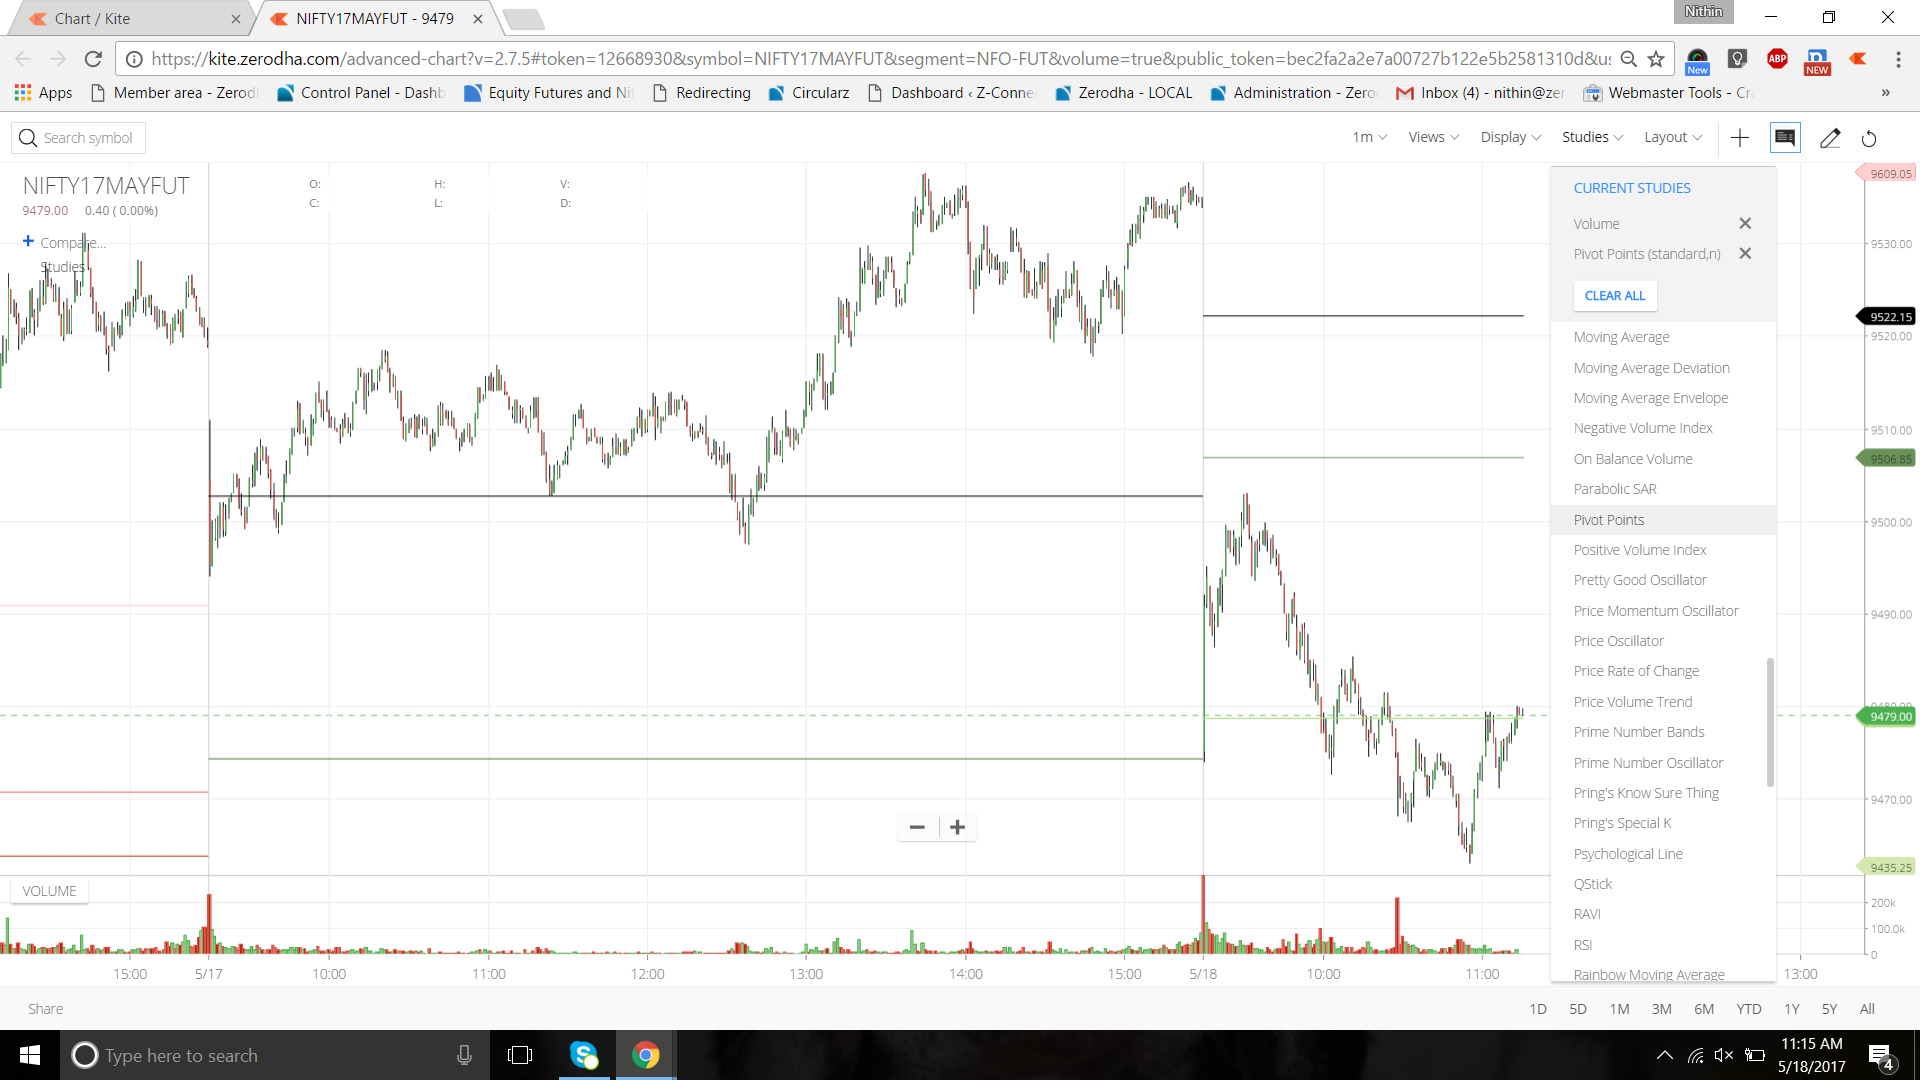
There is a study called pivot points on Kite charts. Clicking on it will draw support and resistance lines automatically.
The pivot point and its support and resistance pairs are defined as follows:
Pivot point (P) = (H + L + C) / 3
Third resistance level (R3) = P + 2*(H – L)
Second resistance level (R2) = P + (H – L)
First resistance level (R1) = (2 * P) – L
First support level (S1) = (2 * P) – H
Second support level (S2) = P – (H – L)
Third support level (S3) = P – 2*(H-L)
where H, L, C are the previous period’s high, low and close
5 Likes
Pivot point is not working in continuous chart- Pi??? 