I just want to compare today’s volume over the average of the last 10 days volume, I mean Today’s volume > last 10 days average volume. How can I draw a moving average line on the volume bars to get the last 10 days average volume in kite.
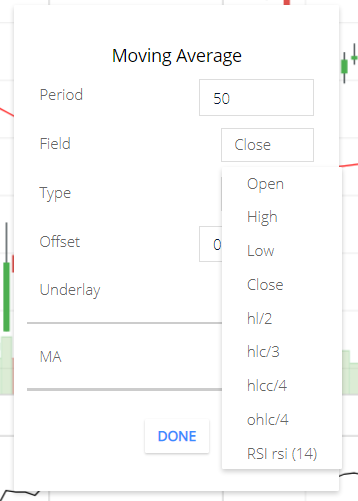
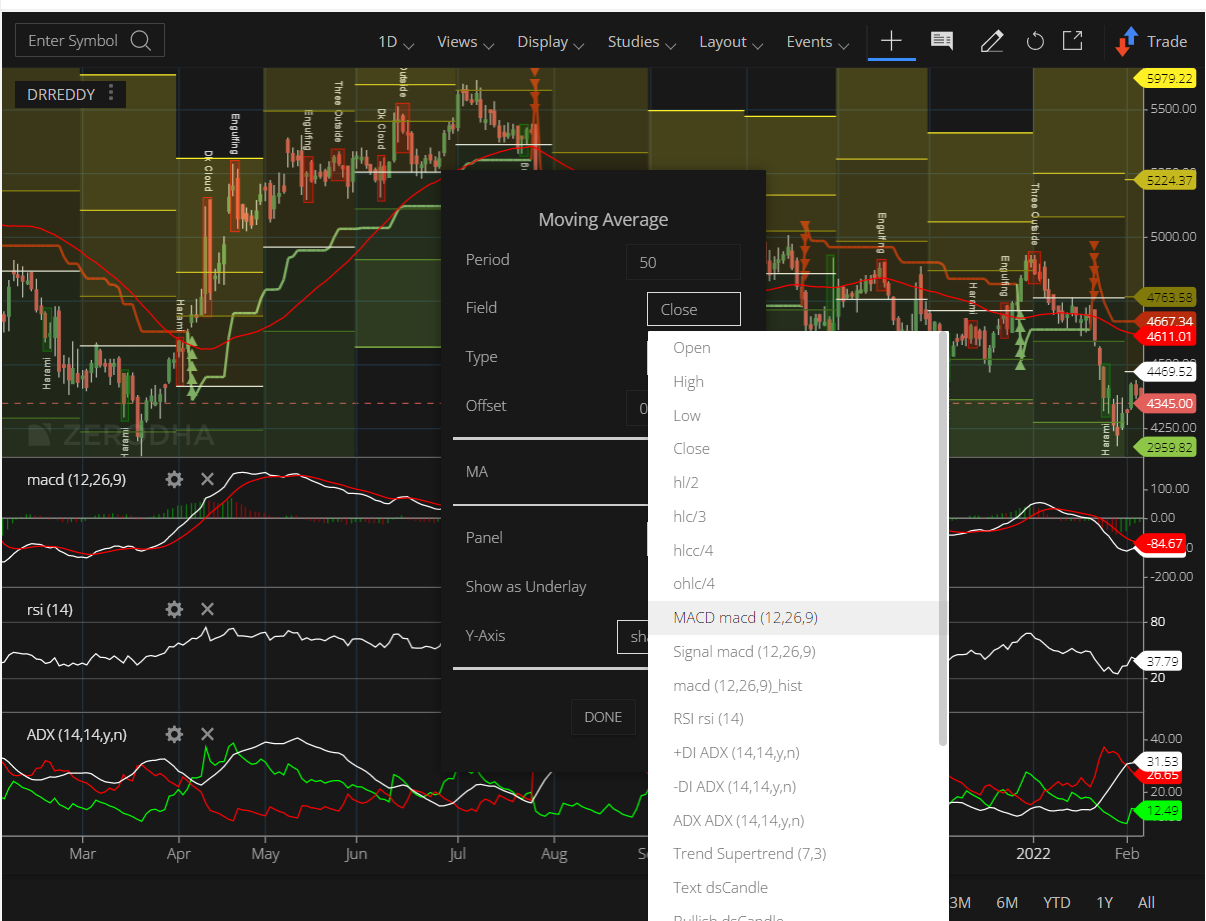
To add a moving average on volume indicator, add the volume indicator from the studies tab first and select moving average from the studies menu .In the config window click on Field and select Volume

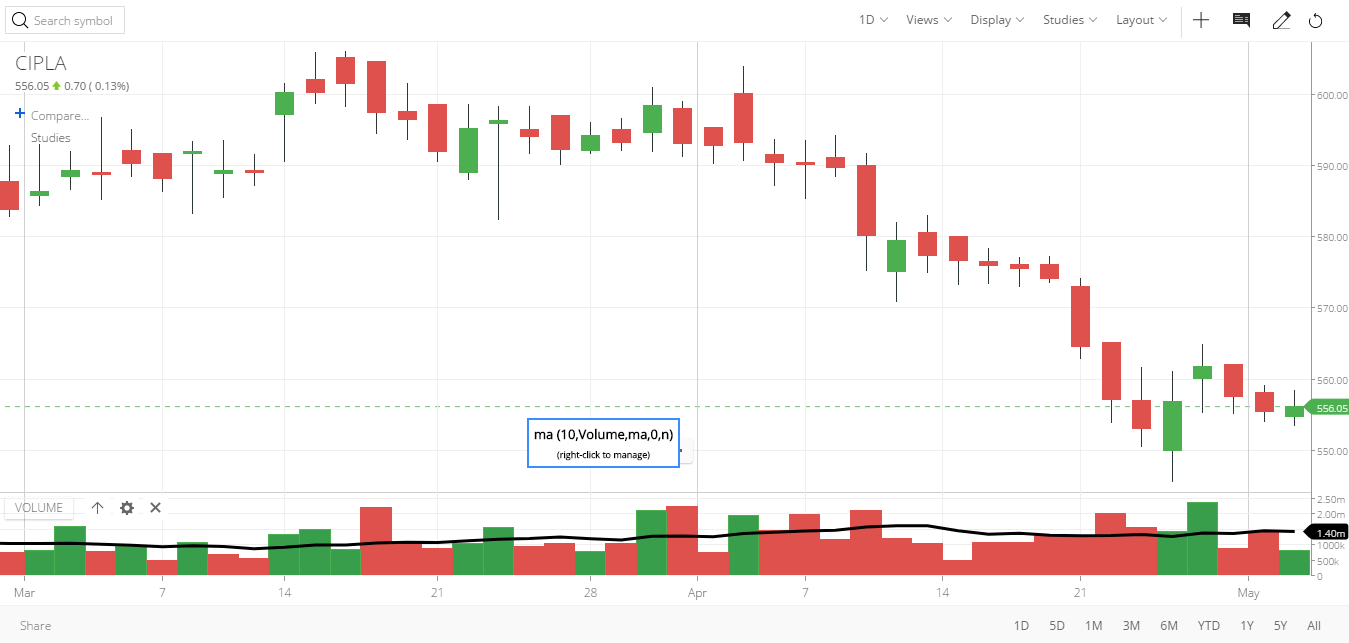
Now you can see the moving average added as a overlay on the volume indicator. In this image I have added a 10 day moving average.
6 Likes
How do we do that in zerodha pi software ?
Not possible to add OI data on Kite currently.
1 Like
It doesn’t work on Volume Overlay, First you need to add Volume Chart indicator from Studies
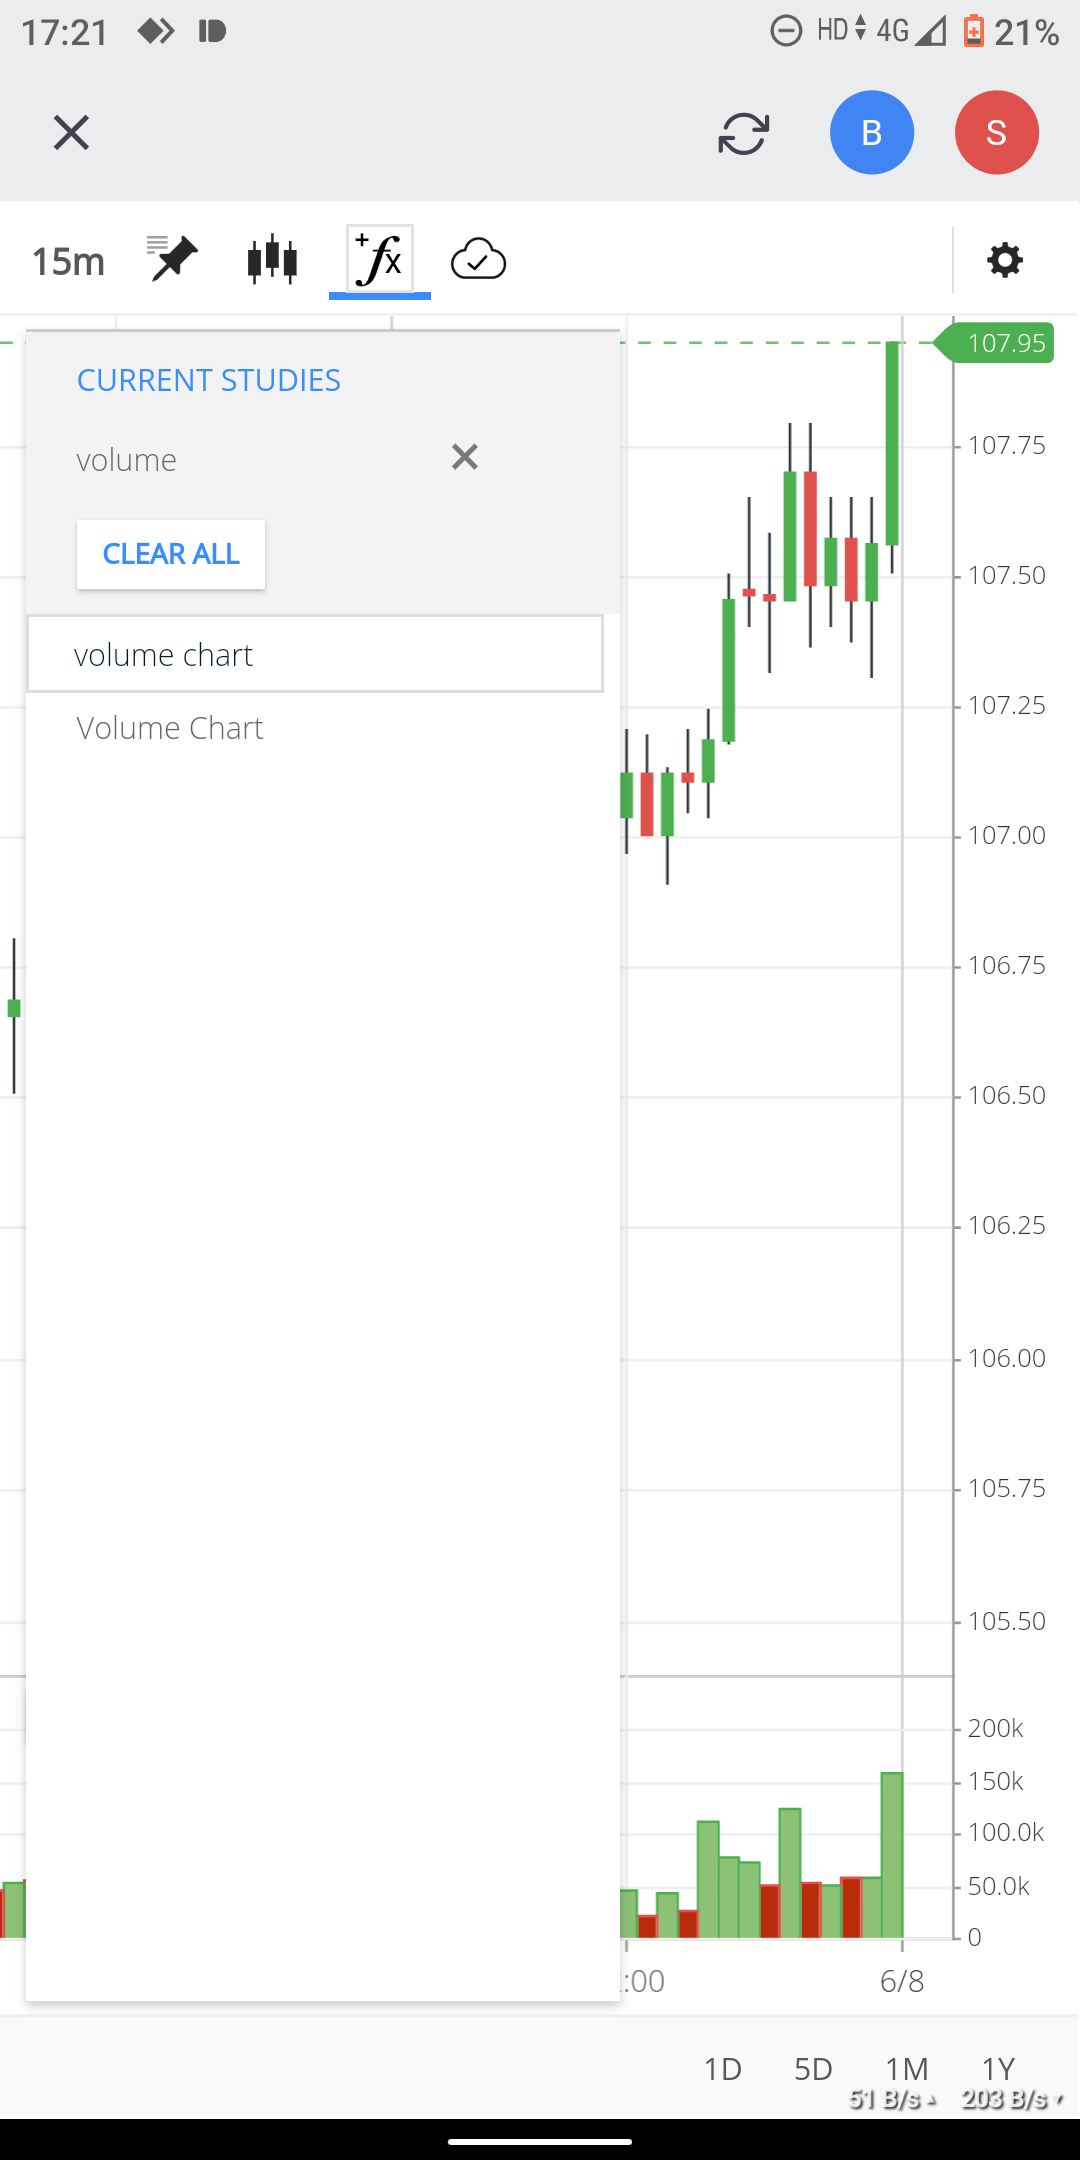
After that add moving average, there you will see Volume, just enter your preferred values and click done and you are all set.

1 Like
That worked like a charm. Thank you : )
You haven’t added Volume Indicator to the charts. It’ll show one you do ![]()
Issue solved. Thanks.