Hello,
I am not able to locate how to plot 5min and 13min EMA intraday chart on Zerodha.
Kindly help,
Best,
AG
Hello,
I am not able to locate how to plot 5min and 13min EMA intraday chart on Zerodha.
Kindly help,
Best,
AG
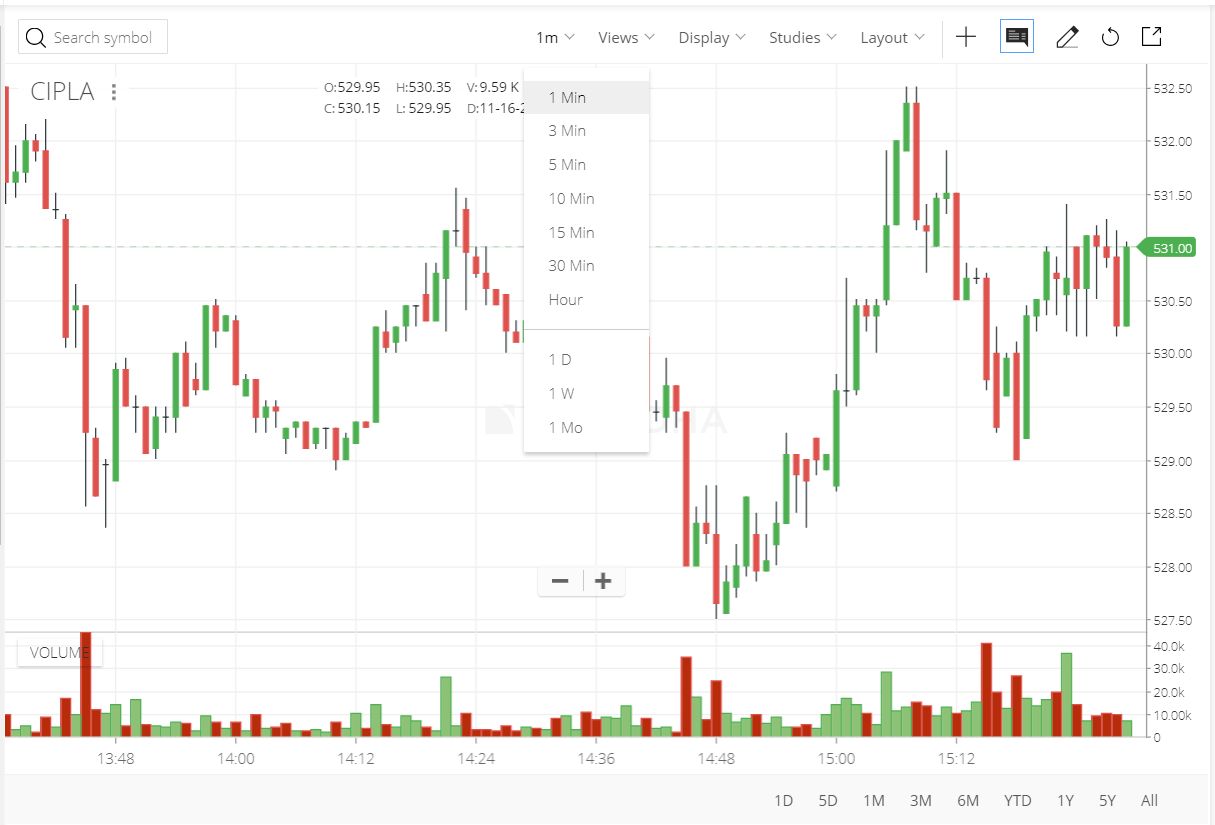
Open a 1 min chart
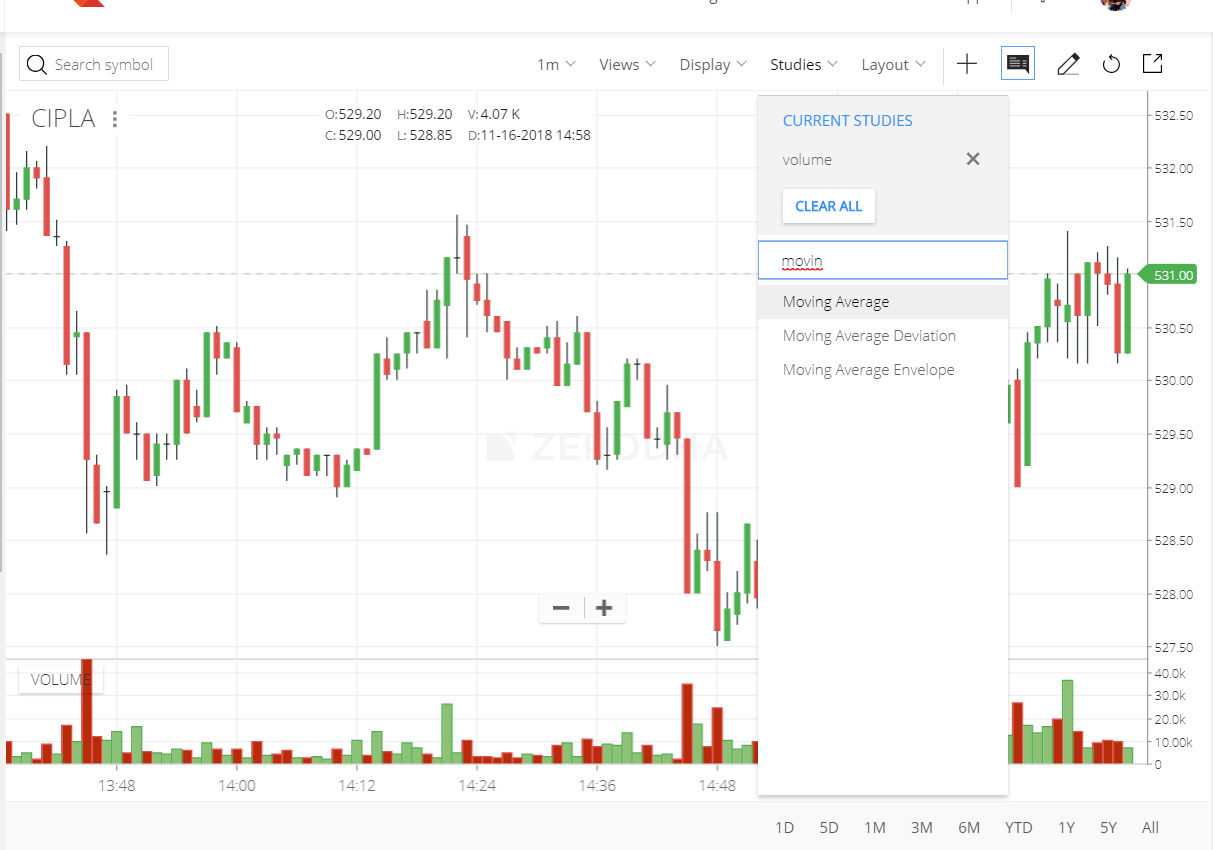
Select moving average in studies
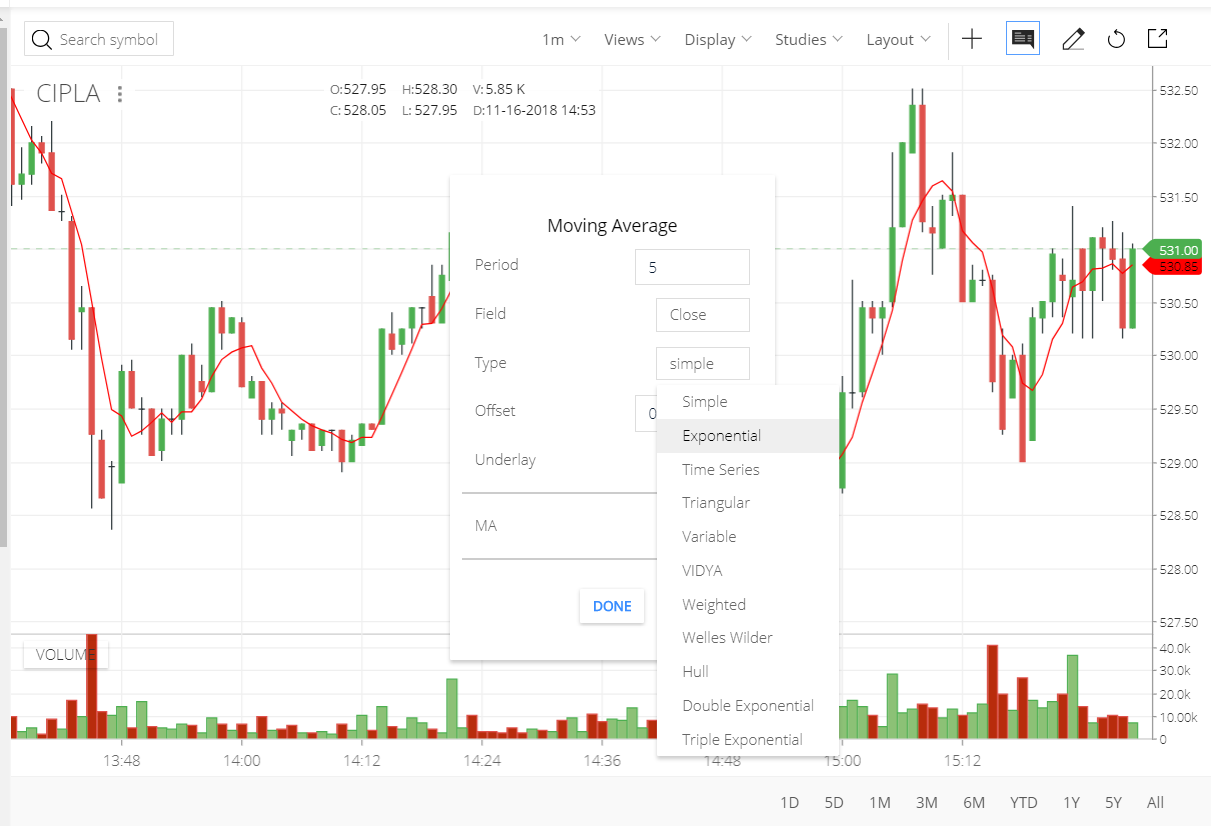
Select period as 5 for 5min and 13 for 13 min. In the dropdown select Exponential
Check the kite user manual
Thanks!