Hello, can anyone tell me how to calculate XIRR for dividends?
Assume a stock X has given me a return of 0% for 3 years, but has given more than 15% in dividends, how do i calculate XIRR in normal case? How do I calculate if I re invested the same?
Hello, can anyone tell me how to calculate XIRR for dividends?
Assume a stock X has given me a return of 0% for 3 years, but has given more than 15% in dividends, how do i calculate XIRR in normal case? How do I calculate if I re invested the same?
To calculate XIRR, you need two sets of data: the cash flows and the corresponding dates. The cash flows should include both the initial investment (negative value) and the dividend payments (positive values).
Let’s consider a simple example: (all in Rs)
Now, assuming you didn’t reinvest the dividends, your cash flows would be: -1000, 150, 200, 250.
If you reinvested the dividends, your cash flows would include the additional investment at the time of reinvestment. Let’s assume you reinvested each dividend immediately:
Now your cash flows would be: -1000, -150, -200, -250, 150, 200, 250.
To calculate XIRR in Excel or a similar tool, you can use the XIRR function. Here’s how you would use it in Excel:
excel
=XIRR(cash_flows, dates)
For the first case (not reinvesting dividends):
excel
=XIRR({-1000, 150, 200, 250}, {0, 1, 2, 3})
For the second case (reinvesting dividends):
excel
=XIRR({-1000, -150, -200, -250, 150, 200, 250}, {0, 1, 2, 3, 1, 2, 3})
These formulas will give you the XIRR for the respective scenarios. The result is the annualized rate of return for your investment, considering both the initial investment and the cash flows from dividends.
Generally accepted way for accounting dividends in XIRR is to consider dividends are reinvested.
Pattu had a great article explaining calculations of XIRR for corporate actions.
you may find it useful
Can i just reduce the dividends received from my original cost of the specific share to arrive at a reduced average.
I feel that average cost is not a sensible measure when purchases are made at vastly different times. Simply because a rupee in the year 2010 is not the same as a rupee in the year 2015. So, for a share held over many years, reducing the original cost by dividends paid over the years doesn’t result in a sensible measure of average cost. XIRR is the way to go.
I would agree with what @ZeroIndian said. No point calculating XIRR if you do not want to consider time value.
How do investors then, manage their cost.
Assume, I buy TCS at 800. I hold 500 shares. Over the years assume, I received cash dividends of 10,000. What will be the average cost.
I have always reduced all the dividends received from my portfolio to show my current cost vs market price and was happy, I made good money.
Let me know the process followed please for an investor.
another related question. If I sell 10 shares of TCS at 3900 today, I make a profit of 3100. How do I adjust this profit. I was reducing this from my average cost. If this acceptable how come the above is not.
Dividend does not change cost. In this eg. avg cost is still 800
Dividends adds to return side, but not reduce cost.
Nor can you use this concept for tax calculation.
This is the important point. Let’s say you were holding TCS for 10 years.
Scenario 1: TCS didn’t pay any dividend for 10 years, and today it paid 10K
Scenario 2: TCS paid 1000 dividend every year. resulting in 10K in 10 years.
In both scenario total dividend is same, and if you use your method, you will get same return number for both scenario. But is it same?
This is where time value of money and XIRR comes into picture
I mean you can use that framework for your personal use, but the data you get is not comparable to anything else.
If you want to compare your returns with a benchmark (say nifty) or some other fund, only good way to do it would be to calculate XIRR, which considers this time value of money and show that return for scenario 2 are much better than return for scenario 1.
Hope this helps
#A: So, there is a lot of confusion regarding the calculation of CAGR across the period with multiple stocks including bonuses, splits, dividends, etc.
#B: I’ll share my way, how you can incorporate these transactions while calculating your CAGR or XIRR.
#C: I have been doing this exercise for more than 5 years continuously and any inputs to improve it are most welcome.
#D: So to start here, I will tell you the notion that my financial management professor taught me in his lecture that to calculate the feasibility of the project we usually calculate its NPV and IRR.
Here, IRR is the rate at which your NPV is zero. The very same logic we apply here.
#E: CAGR (or XIRR) is the rate at which your total investment (no matter whether it is realised or unrealised, dividend received which technically reduces your cost or some transaction cost incurred) is equal to the current value of your portfolio.
#F: Let us see how.
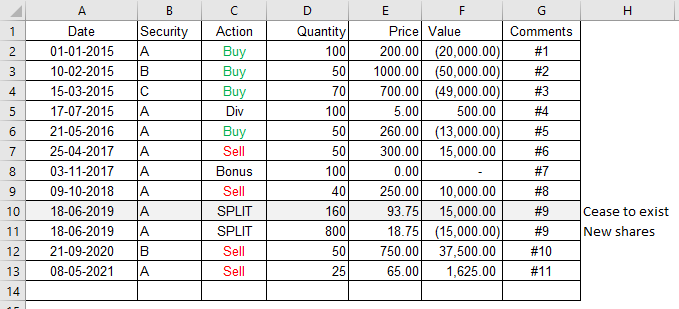
#1 Bought 100 quantity of stock A at Rs. 200. (01/01/2015)
#2 Bought 50 quantity of Stock B at Rs. 1000. (10/02/2015)
#3 Bought 70 quantity of Stock C at Rs. 700. (15/03/2015)
#4 Dividend Rs. 5 per share for Stock A (17/07/2015)
#5 Bought 60 additional quantity of stock A at Rs. 260. (21/05/2016)
#6 Sold 50 quantity of stock A at Rs. 400. (25/04/2017)
#7 1:1 bonus for stock A (03/11/2017).
#8 Sold 40 quantity of stock A at Rs. 250 (09/10/2018)
#9 5:1 Stock split for Security A. It means you receive 5 new shares for every old share (-1 old and +5 new) (18/06/2019)
#10 Sold 50 quantity of stock B at Rs. 750. (21/09/2020)
#11 Sold 25 quantity of stock A at Rs. 65 (08/05/2021)
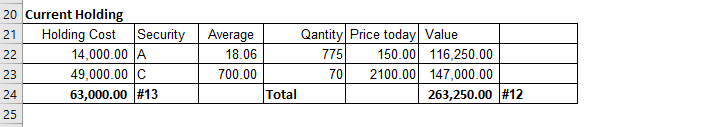
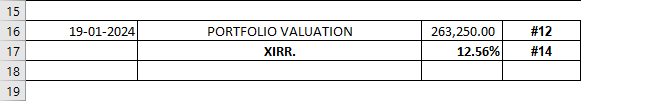
#12 Now we need to calculate the current holding valuation this can simply done using your broker’s back-office files. (#12 for current valuation and #13 for holding cost)
#14 Use XIRR formula from #1 to #12.
Here you are done with your CAGR.
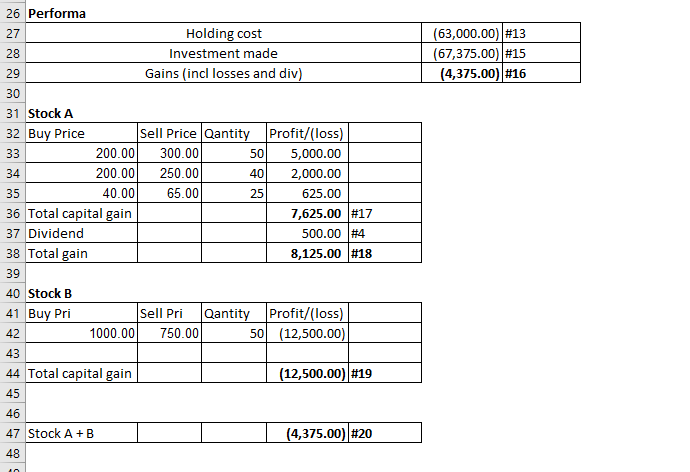
As earlier said in #E this value includes both realised and unrealised gains/losses.
So if you further want to see the breakup of your gains you can create a separate per-forma.
#15 Calculate total inflow and outflow (from #1 to #11)
#16 Compare #13 and #15, you will get gains/losses realised.
#18, #19, #20. Further, you can create more breakups for individual stocks. I think it is self-explanatory, so let me know with #n if you have any queries regarding this.
Tracking dividends separately for XIRR is more work than it’s worth. Here’s the simpler way to think about it:
If you reinvested the dividend — it came back as a fresh deposit to your broker account. Your fund statement records it automatically. It’s already in your XIRR without any extra work.
If you didn’t reinvest — just add the total dividends received to your current holdings value when you calculate. It’s money the investment generated, it belongs on the “what you have
today” side.
For your example: stock X gave 0% price return but 15%+ dividends over 3 years. If reinvested, already captured. If not, add ₹X dividends to current value. XIRR will reflect the true total
return either way.
No need for a separate dividend XIRR — the fund statement approach handles it cleanly.
No, you simply cannot just add dividends to your current holdings value. That ignores dividend timing.