Hello!
As newbie, want to understand how the FII & DII trading activity could be related to Day’s Trading value.
Can we even make correlation between two?
or available public data is not sufficient to find co-relation?
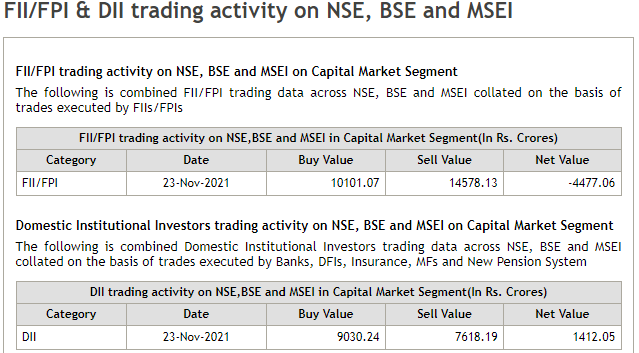
Like, Today 23 November 21,
FII & DII Activity are following in Cr : FII(Buy 10101.07 ,Sell 14578.13) & DII (Buy 9030.24 ,Sell 7618.19)
And total trading value in NSE was 76.2K Cr
https://www1.nseindia.com/products/content/equities/equities/homepage_eq.htm
And in BSE was 18.8K Cr
https://www.bseindia.com/markets/equity/EQReports/TradeSummary.html
So how this number are related… (in Cr) (my main query!!!)
Like : FII SELL & BUY + DII SELL & BUY + Other = NSE +BSE traded value?
10101.07 + 14578.13 + 9030.24 + 7618.19 + Others (Retail + HNI + so on…) = 76.2K + 18.8K
Few Idea is to understand:
What is approx exposure of FII & DII in day trading value.
What is exposure of Retail or Other category…
Maybe such data already exist in public domain, if so, please guide to same.
Thanking to all experts in advance!!