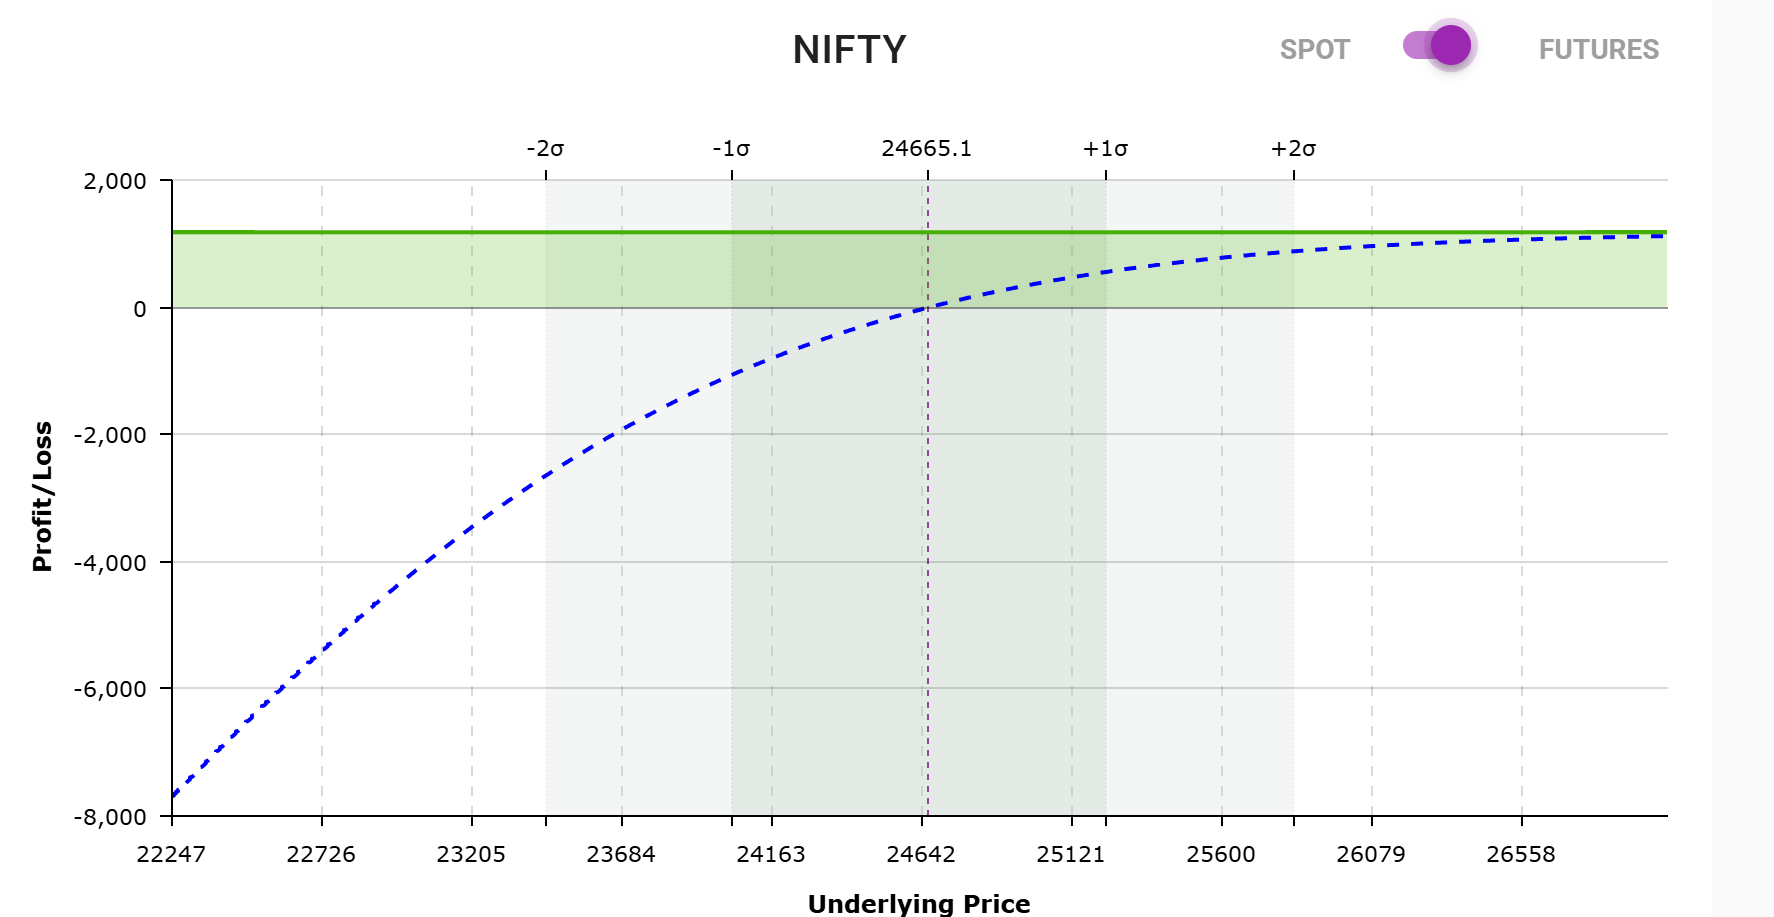
Please check the attached photo, I was just trying out Opstra strategy builder and created a very simple strategy, it’s literally showing 100% Prob of Profit. But in the blue line it’s showing loss at many movements but the blue line is only applicable when we close the position on the same day right? So does that mean, if we keep this position till expiry, it will actually only return in profit, can anyone tell how realistic opstra charts are? And what will actually happen in real life scenario?
what is your strategy? without it no one can comment on the graph.
in general , without knowing your strategy, in my experience its true, “blue line” is important