I’m a Zerodha user and I’ve been using TradingView for my technical analysis. I recently noticed that TradingView lacks the Percentage Change that I used to have in Kite charts, the same thing that comes in the bottom left, which shows the %age change in stock during the period chosen. I find this feature quite useful for my trading strategies.
Does anyone here know how to add the Percentage Change to TradingView charts when using Zerodha as the broker?
You can refer to below screenshot to add price range. Once you select the are drag point A to B based on the range and it shall show percentage change.
If I understood this correctly, it shows vertical price change (from top to bottom).
However, I am interested in the horizontal price change, that is with time, what is the price change in the last 3 months, 5 months, and so on…
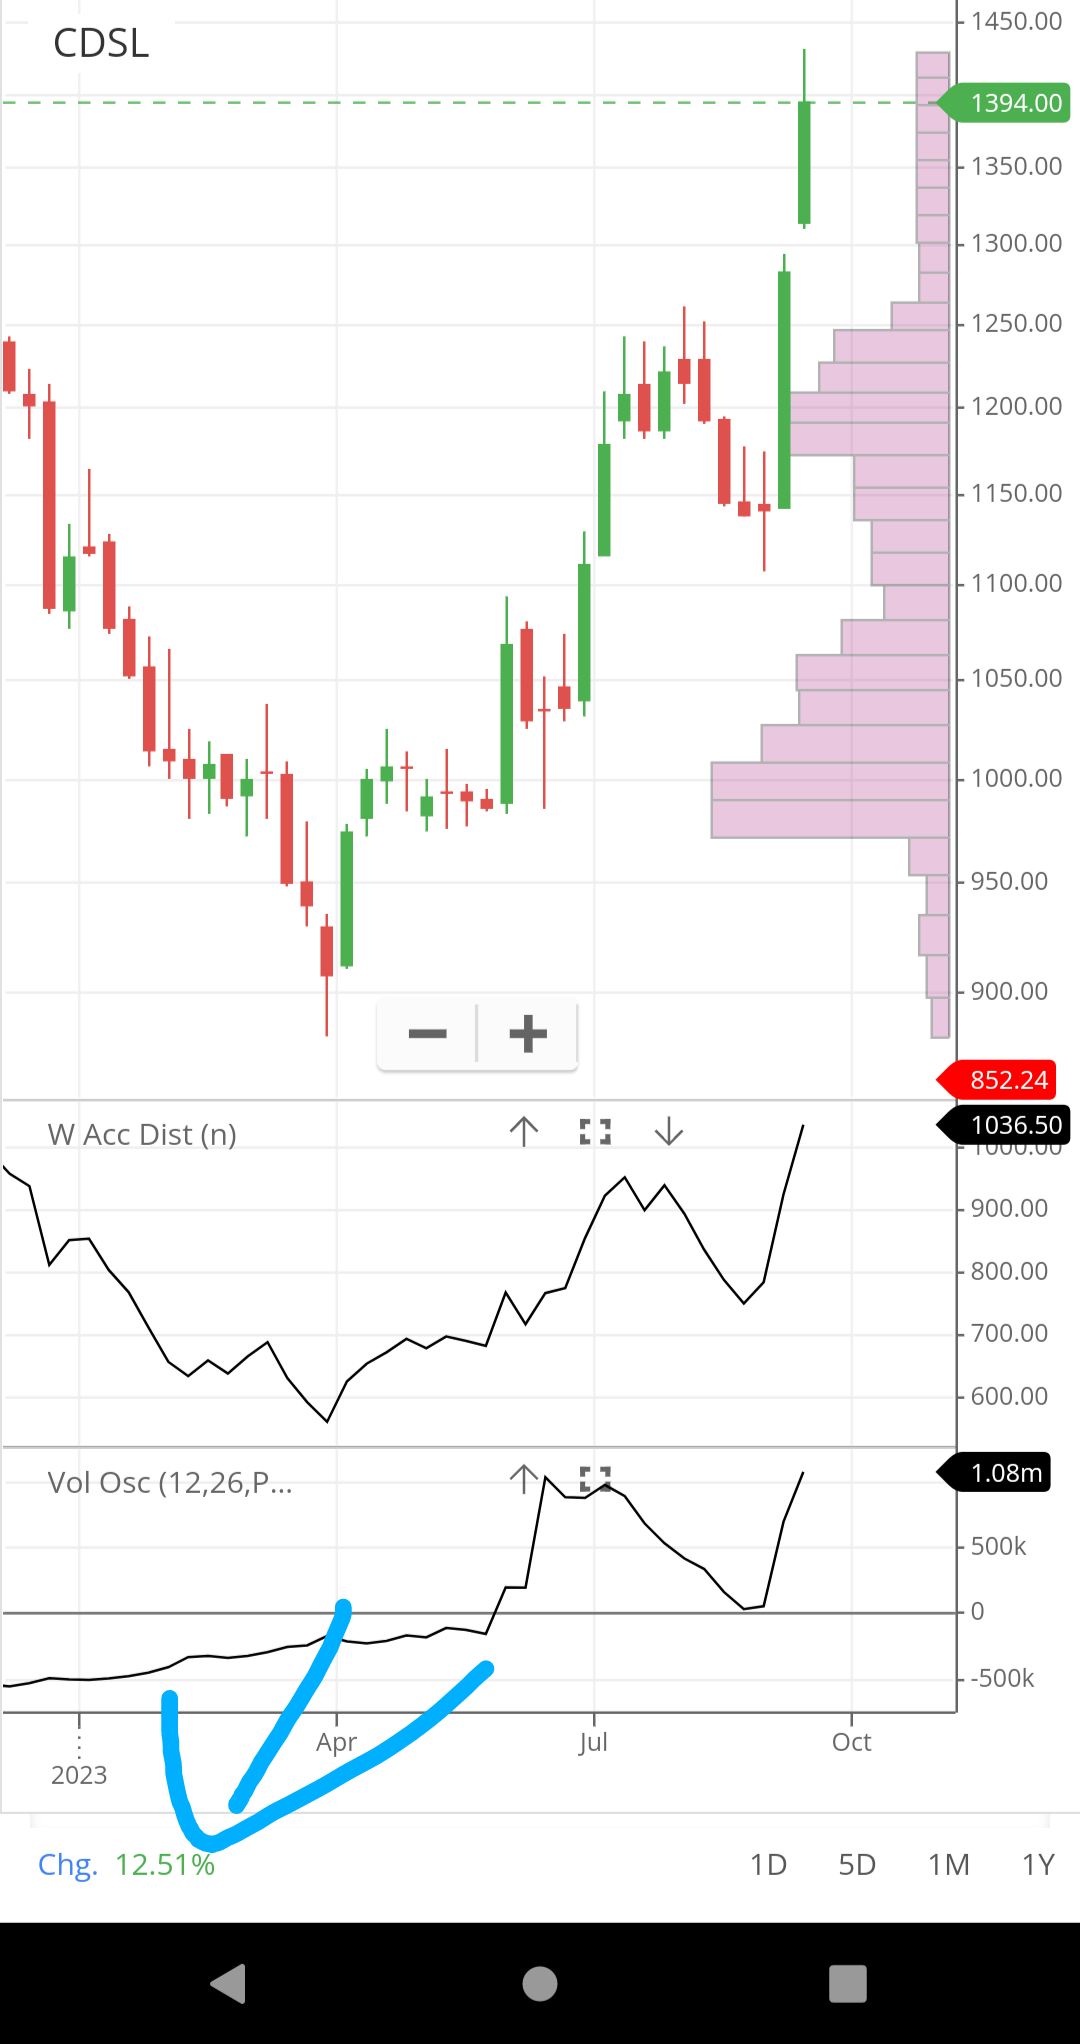
Something like this, which shows Reliance price increased by 7.29% in last 6 months…