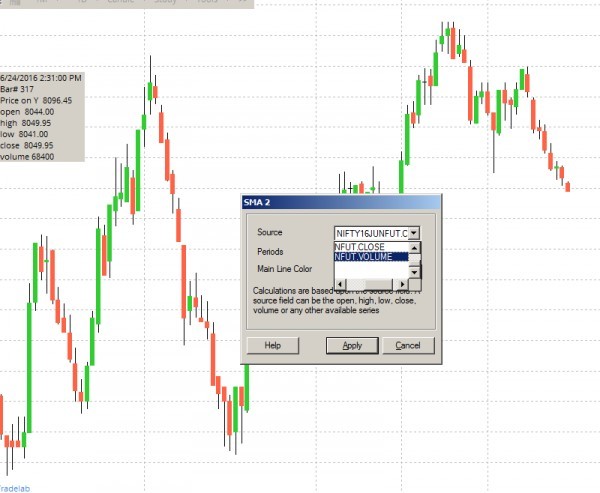
If you want to plot the 10 day Moving average on zerodha pi,
open the chart and go to study and select Simple Moving average and select the source option to volume and periods as 10, as shown in below screenshot and drag the SMA line on the volume bars
if you want to backtest or create scripted alerts check the below code on day candle time frame
LAST > SMA(VOLUME,10)