Now I got it ![]()
You want to combine prices of multiple Options and view it as single line chart, which might not be possible but you can compare prices of multiple Options and plot them on one chart, check the below screenshot, I’ve plotted prices of 12000 CE, 12100 CE and 12200 CE, you cannot combine prices of all 3 in one line but can compare prices of all 3 on one chart.
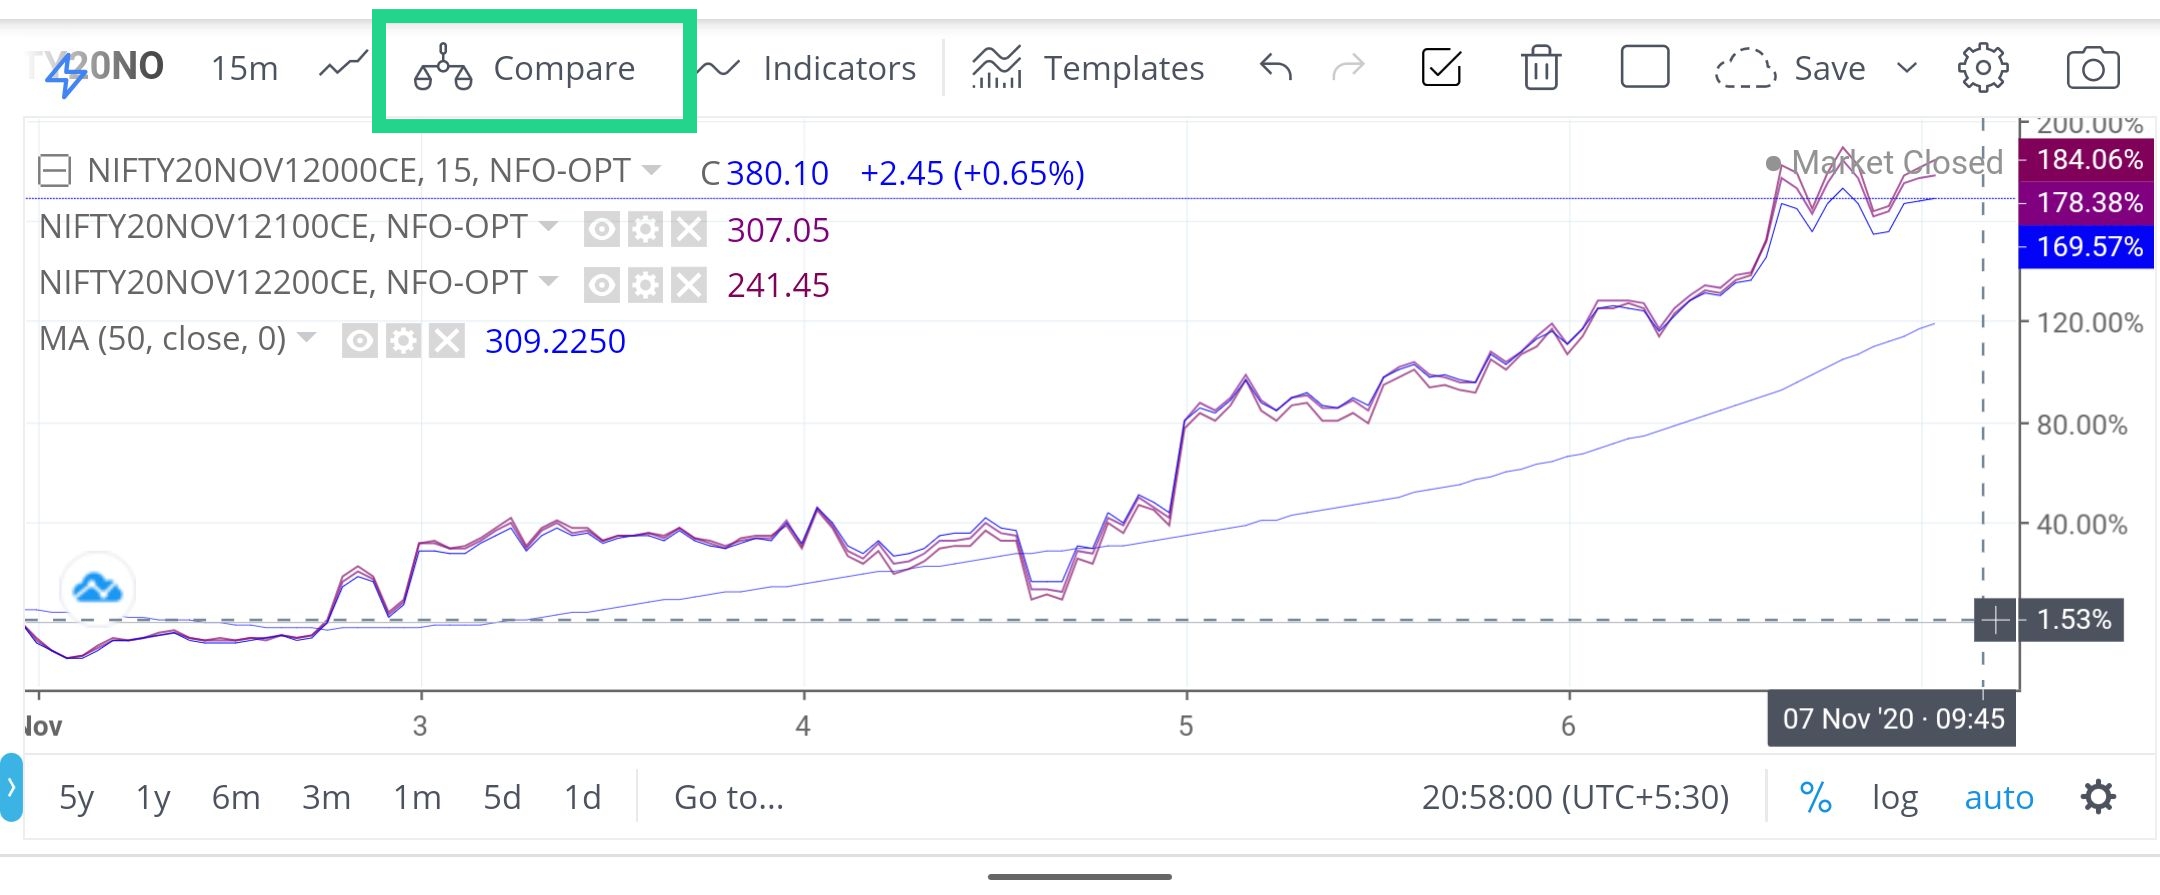
… and have also plotted 50 MA, as you can see in the above picture.