How to filter out the stocks that have bollinger band squeeze setup. With the help of an AFL

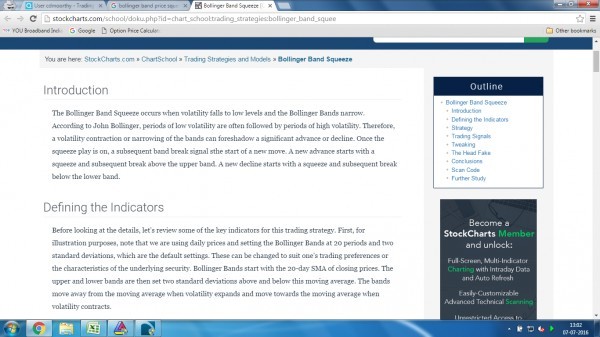
First of all - Let us understand what is Bollinger band squeeze... Stockcharts.com  has nicely explained this..

Here is the link - and screen shot of that...

http://stockcharts.com/school/doku.php?id=chart_school:trading_strategies:bollinger_band_squee


Now how to find out BB squeeze.?. because  one need some kind of parameter to compare  the gap between bands - that should be lesser or greater than that..

Here,  I use ATR..

If the BB gap is lesser than ATR then there is squeeze..  AFL will filter it out.

You can use any other parameter if you find it more logical or acceptable... No compulsion to use only ATR only.

Also I spiced it up with RSI....  Suppose if BB Squeeze is setup is found when RSI is at the bottom some where below 30.. then probabilities of highly profitable breakout on the upside would be there..

Again.. this is just a probability only... Risk is still there.

This BB squeeze setup filtering AFL was published and shared in public to all during November 2014.. in my blog mayacapitalmarket.

Screen shot is attached:


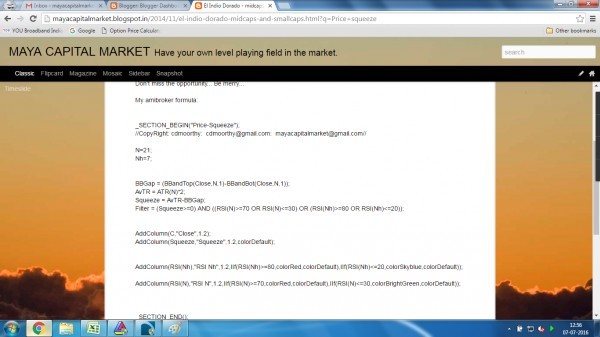
_SECTION_BEGIN("Price-Squeeze");
//CopyRight: cdmoorthy:  [email protected]:  [email protected]//

N=21;
Nh=7;
BBGap = (BBandTop(Close,N,1)-BBandBot(Close,N,1));

Squeeze = (ATR(N)*2)-BBGap;
Filter = (Squeeze>=0) AND ((RSI(N)>=70 OR RSI(N)<=30) OR (RSI(Nh)>=80 OR RSI(Nh)<=20));


AddColumn(C,"Close",1.2);
AddColumn(Squeeze,"Squeeze",1.2,colorDefault);


AddColumn(RSI(Nh),"RSI Nh",1.2,IIf(RSI(Nh)>=80,colorRed,colorDefault),IIf(RSI(Nh)<=20,colorSkyblue,colorDefault));
AddColumn(RSI(N),"RSI N",1.2,IIf(RSI(N)>=70,colorRed,colorDefault),IIf(RSI(N)<=30,colorBrightGreen,colorDefault));

_SECTION_END();

Disclaimer:   This is for educational / entertainment purpose only.  No liabilities what so ever will be accepted.  Please trade with strict stop losses.

1 Like

As per the above condition check the below AFL code for BB squeeze


/*
	Bollinger bands squeeze.

	This is a volatility indicator. 
	It can be used to determine the periods of extremes of low volatility which usually followed by big moves.
 	Indicator does not show direction of the trade, only timing. 
 	Some other aspects of technical/fundamental analysis should be employed for direction.

	There is a signal line with colored dots. Red dots indicate periods of low volatility (sqeeze). 
	Green dots indicate periods of high volatility.
	Indicator line crosses above and below signal line. Time trades at historical extremes of low volatility.

	It can be used for scans, for instance, to find stepper stocks before big moves.
	The original author of the idea uses it for intraday trading.

	For confirmation look for sqeezes in two different time frames.

*/

Length = 8;
Price = EMA(Close, Length);

// Keltner 
kLength = Length;
kN = 1.5;
kATR = ATR(kLength);
kUpper = Price + kN * kATR;
kLower = Price - kN * kATR;

// Bollinger
bbLength = Length;
bbN = 2;
bbStDevValues = StDev(Close, bbLength);
bbUpper = Price + bbN * bbStDevValues;
bbLower = Price - bbN * bbStDevValues;

IsSignal = 
	bbUpper <= kUpper AND
	bbLower >= kLower;

Graph0 = 1;
Graph0Style = styleDots;
Graph0BarColor = IIf(IsSignal, colorRed, colorGreen);

Proportion = (kUpper - kLower) / (bbUpper - bbLower);
Graph1 = Proportion;

Title = "Next Move Signal. In squeeze: " + WriteVal(IsSignal, 1) + " Keltner/Bollinger: " + WriteVal(Proportion);
1 Like

Hi Mr. Moorthy . Thanks for above explanation and AFL I have a question you said iff bbq sqeez setup found when RSI is some where 30 then the stock will break out on upperside In your AFL what does sky blue color indicate, does it indicate possibility of upside and what does green color indicates? if you can please eloborate more on that. Thanks

coloring only indicates whether RSI reached the bottom or top. - RSINh if it reaches below 20 the system automatically colors it to skyblue… the same way for RSIN if it reaches below 30 green color will be applied in the report.
On the other hand if they reached the top RED color is applied.
These are only for facilitating the user to identify which one is triggered…
For example - RSIN is still above 30… No color applied - but on the same date RSINh reached below 20 so blue color is applied.
Then you may ask, why should I use RSINh and RSI - No need for it… you can use only one also.
My point is, one can either add any number of conditions or No condition at all. It all depends what the user wants to have. Also to find out BBGap, one can take geometric mean point of last two days instead of Close price. (BTW: have you gone through my other post here: http://tradingqna.com/42027/manipulating-indicator-educational-knowledge-sharing-exercise
You can manipulate it to get an early signal at your will and wish… You can optimize it… Only thing we need is patience / devotion and determination to find out our own edge.
Regards

Hi AG,
Can this code be used in PI ?
If not then how shall i define the squeeze in PI ?
I tried your this code in PI ,but it gives error as ‘8;’ variable not defined.

Can you please give me code to locate(scan) BB squeeze in PI ?

Please help !
Regards,
Vivek