guide any successful strategy…
4 Likes
OK - so here we go.
The first step is to understand what is 315 .. its advatages and disadvantages.
The second step is to understand some rules I have derived to use it effectively. Rules are related to effective entries, effective SL management, effective profit bookings, effective re-entries and in the end effective money management or effective safeguarding the capital.
In this post I would focus on step 1 i.e what is 315 etc.
315 Strategy for swing trading
315 is a simple swing technique which tries to identify a trend very early. In this strategy we use only EMAs name EMA 3 & EMA 15 (hence the name 315).
People ask me why EMA 3 and EMA 15 .... for me last 3 days define the immediate average price ... to find the slightly longer term trend i use the factor of 5. This is becuase 5 has an interesting relevance to markets.... we have approx 5 hours of trading everyday, 5 trading days in a week, almost 5 trading weeks in a month .... So I simply multiple 3 by 5 to get my 15 EMA which defines my medium term average price.
Now in simple terms, if our immediate average price is higher than the medium term average price that means we are entering in a bull swing ... and visa versa. Hence the strategy entries are:
1 Enter Long when 3 EMA goes above 15 EMA (High)
2 Enter Short when 3 EMA goes below 15 EMA (Low)
Advantages of following 315 strategy
1. A simple technique using just 2 EMAs, no other oscilattors or indicators required. NO advanced charting softwares required.
2. System is based on following the ULTIMATE indicator available i.e price action.
3. Keeps a trader in the trend, lets the full swing to complete. Never gets a trader against the trend.
4. Since we are just following price action, we dont need to worry about divergences etc.
Disadvantages of 315 Strategy
1. Works brilliantly in a trending market but can whipsaw in extremely ranging markets. However this can be overcome by certain rules and money management to be explained later in this thread.
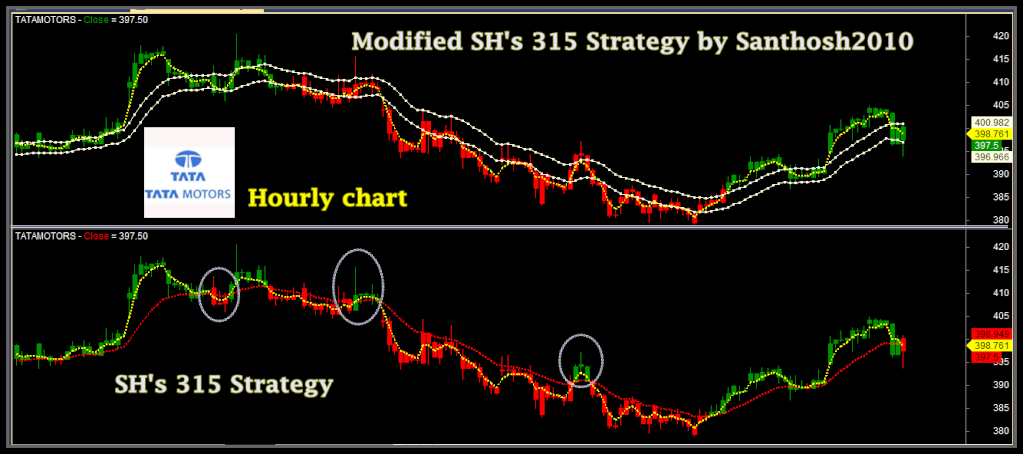
315 strategy ~ Amibroker formula
_SECTION_BEGIN("MA Cross");

//Modified SH's 315 Strategy by Santhosh2010
// Traderji id :Santhosh2010

e1=EMA(C,3);
e2=EMA(H,15);
e3=EMA(L,15);

Plot(e1,"",colorYellow,styleDashed |styleThick);
Plot(e2,"",colorLightYellow,styleDots );
Plot(e3,"",colorLightYellow,styleDots );

b1=Cross(e1,e2);
s1=Cross(e3,e1);
Buysetup=Flip(b1,s1);
Shortsetup=Flip(s1,b1);
trend=IIf(BarsSince(Buysetup)<BarsSince(Shortsetup ),1,0);
Col=IIf(trend==1,colorGreen,4);
SetBarFillColor(Col);
Plot(C,"Close",Col,64);

_SECTION_END();
6 Likes
olny answer is market study and our own assessments on any strategies before it apply
1 Like
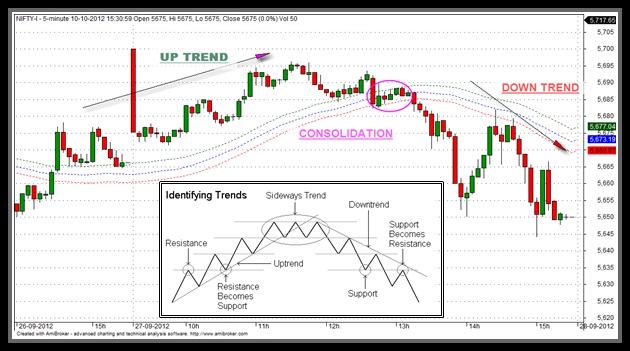
Try to answer some basic questions while finding intraday trend, it is helpful to find intraday trend.
Where is price now in relation to yesterday close ? Is price is above yesterday high/low ? Where is price in relation to today’s High - Low range ?
1 Like
Supertrend is a popular Trend following strategy being used by systematic traders. Generally it is being used on 15 min timeframe to track the trend of instruments such as Nifty and Commodities like copper, gold, silver etc.
This is a screenshot of supertrend indicator with buy /sell arrows.

Following is the Afl code of supertrend by rajendran from marketcalls.in
_SECTION_BEGIN("SuperTrend");
SetBarsRequired(100000,0);
GraphXSpace = 15;
SetChartOptions(0,chartShowArrows|chartShowDates);

Plot( C, "Close", ParamColor("Color", colorBlack ), styleNoTitle | ParamStyle("Style") | GetPriceStyle() );

_N(Title = StrFormat("{{NAME}} - {{INTERVAL}} {{DATE}} Open %g, Hi %g, Lo %g, Close %g (%.1f%%) {{VALUES}}", O, H, L, C, SelectedValue( ROC( C, 1 ) ) ));

PositionSize = 100000;

Factor=Optimize("Factor",2,2,10,1);
Pd=Optimize("ATR Periods",11,1,20,1);
Up=(H+L)/2+(Factor*ATR(Pd));
Dn=(H+L)/2-(Factor*ATR(Pd));
iATR=ATR(Pd);
TrendUp=TrendDown=Null;
trend[0]=1;
changeOfTrend=0;
flag=flagh=0;

for (i = 1; i <BarCount; i++) {
      TrendUp[i] = Null;
      TrendDown[i] = Null;

      trend[i]=1;

if (Close[i]>Up[i-1]) {
         trend[i]=1;
         if (trend[i-1] == -1) changeOfTrend = 1;

      }
      else if (Close[i]<Dn[i-1]) {
         trend[i]=-1;
         if (trend[i-1] == 1) changeOfTrend = 1;
      }
      else if (trend[i-1]==1) {
         trend[i]=1;
         changeOfTrend = 0;
      }
      else if (trend[i-1]==-1) {
         trend[i]=-1;
         changeOfTrend = 0;
      }

      if (trend[i]<0 && trend[i-1]>0) {
         flag=1;
      }
      else {
         flag=0;
      }

      if (trend[i]>0 && trend[i-1]<0) {
         flagh=1;
      }
      else {
         flagh=0;
      }

      if (trend[i]>0 && Dn[i]<Dn[i-1]){
         Dn[i]=Dn[i-1];
        }

      if (trend[i]<0 && Up[i]>Up[i-1])
        { Up[i]=Up[i-1];
        }

      if (flag==1)
       {  Up[i]=(H[i]+L[i])/2+(Factor*iATR[i]);;
        }
      if (flagh==1)
        { Dn[i]=(H[i]+L[i])/2-(Factor*iATR[i]);;
         }
      if (trend[i]==1) {
         TrendUp[i]=Dn[i];
         if (changeOfTrend == 1) {
            TrendUp[i-1] = TrendDown[i-1];
            changeOfTrend = 0;
         }
      }
      else if (trend[i]==-1) {
         TrendDown[i]=Up[i];
         if (changeOfTrend == 1) {
            TrendDown[i-1] = TrendUp[i-1];
            changeOfTrend = 0;
         }
      }
   }

Plot(TrendUp,"Trend",colorGreen);
Plot(TrendDown,"Down",colorRed);

Buy = trend==1;
Sell=trend==-1;

Buy=ExRem(Buy,Sell);
Sell=ExRem(Sell,Buy);
Short=Sell;
Cover=Buy;

BuyPrice=ValueWhen(Buy,C);
SellPrice=ValueWhen(Sell,C);
ShortPrice=ValueWhen(Short,C);
CoverPrice=ValueWhen(Cover,C);

Title = EncodeColor(colorWhite)+ "Super Trend AFL code from www.marketcalls.in" + " - " +  Name() + " - " + EncodeColor(colorRed)+ Interval(2) + EncodeColor(colorWhite) +
 "  - " + Date() +" - "+"\n" +EncodeColor(colorRed) +"Op-"+O+"  "+"Hi-"+H+"  "+"Lo-"+L+"  "+
"Cl-"+C+"  "+ "Vol= "+ WriteVal(V)+"\n"+
EncodeColor(colorLime)+
WriteIf (Buy , " GO LONG / Reverse Signal at "+C+"  ","")+
WriteIf (Sell , " EXIT LONG / Reverse Signal at "+C+"  ","")+"\n"+EncodeColor(colorYellow)+
WriteIf(Sell , "Total Profit/Loss for the Last Trade Rs."+(C-BuyPrice)+"","")+
WriteIf(Buy  , "Total Profit/Loss for the Last trade Rs."+(SellPrice-C)+"","");

PlotShapes(IIf(Buy, shapeSquare, shapeNone),colorGreen, 0, L, Offset=-40);
PlotShapes(IIf(Buy, shapeSquare, shapeNone),colorLime, 0,L, Offset=-50);
PlotShapes(IIf(Buy, shapeUpArrow, shapeNone),colorWhite, 0,L, Offset=-45);
PlotShapes(IIf(Short, shapeSquare, shapeNone),colorRed, 0, H, Offset=40);
PlotShapes(IIf(Short, shapeSquare, shapeNone),colorOrange, 0,H, Offset=50);
PlotShapes(IIf(Short, shapeDownArrow, shapeNone),colorWhite, 0,H, Offset=-45);

_SECTION_END();
6 Likes
There are many strategies to find the start of a trend. Some of the examples are as below.
-
Based on price channels. Price Channels are lines set above and below the price of a security. The upper channel is set at the x-period high and the lower channel is set at the x-period low. For a 20-day Price Channel, the upper channel would equal the 20-day high and the lower channel would equal the 20-day low. Read more at http://stockcharts.com/school/doku.php?id=chart_school:technical_indicators:price_channels
-
Based on moving average cross-overs. The moving averages can be used to identify the direction of the trend. Read more at http://stockcharts.com/school/doku.php?id=chart_school:technical_indicators:moving_averages
-
Based on breakouts of channels and envelopes. Read more at http://stockcharts.com/school/doku.php?id=chart_school:technical_indicators:average_true_range_a
-
Based on Bollinger bands. Read more at http://stockcharts.com/school/doku.php?id=chart_school:technical_indicators:bollinger_bands
-
Based on Technical Indicators and Overlays like MACD, Stochastic Oscillator, etc. Read more at http://stockcharts.com/school/doku.php?id=chart_school:technical_indicators:moving_averages
Exit strategies include trailing stops, targets, and cross-over exits, etc.
Note: The very basic nature of stock market is uncertainty. Nobody knows where market moves. Nobody can predict the market moves at all times. So a strategy cannot be guaranteed to work forever or for a certain period of time. Even though a strategy could have performed very well in the past there’s no guarantee that it will perform in the same lines and till what period of time.
PS: Since the reference site contains lot of information I had to give links to individual points. I tried to help find the information I mentioned.
2 Likes
The charts and indicators are forecasting tools for your wishful thinking.
In the end its the broker who is making money, not you.
Price action and volume action within intraday chart are the best trend indicators in any strategy.
For truely 2D & 3D integrated trading techniques feel free to download 100% free professional intraday trading strategies here : http://intradaytradingsecrets.blogspot.in/
I use RSI and ADX combination to find Intraday trends for Stocks and Indices. As a general rule, when RSI crosses an upper limit it indicates a Sell signal, while if it crosses lower limit it indicates Buy signal. But in this strategy, I do the opposite i.e. Buy when RSI crosses upper limit and Sell when RSI crosses lower limit. ADX would be used as a trend identifier while taking Buy/Sell decisions.
Below are the rules of this strategy:
| Paramter | Value |
| Preferred Timeframe | Intraday 1 minute |
| Indicators Used | RSI(17), ADX(14) |
| Buy Condition | RSI(17)>=75 AND ADX(14)>25 |
| Short Condition | RSI(17)<=25 AND ADX(14)>25 |
| Sell Condition | Same as Short Condition OR Time>=03:15 PM |
| Cover Condition | Same as Cover Condition OR Time>=03:15 PM |
| Stop Loss | 0.5% |
| Targets | No fixed target, Stop and reverse when AFL gives opposite signal |
| Position Size | 150 (fixed) or 80% of equity (as per your risk appetite) |
Read more about this strategy and download the AFL code from the below link:
http://tradingtuitions.com/afl-of-the-week-intraday-trading-strategy-for-nifty/
1 Like
Do not complicate mcuh.. Go the simple way..
First check the trend of the market or a stock on daily and weekly chart... Then get deep into the intraday chart by choosing a time frame say 15Min or 30Min and see whether market is making higher tops and higher bottoms.
Intraday trend is the part of the bigger trend (Daily or weekly). So it is always beneficial to take the day trade in the direction of the daily or weekly trend....
Never Bluff With the Trend of the Market - Specially the Bigger Trend
So, if daily and weekly tend is up and on intraday chart say 30 min and 15min the trend is up then there are high probabilities for the market to go up and it is suggesting to take a long trade with stop loss of previous major bottoms.
Also, there are other key elements to consider and evaluate while trading... Human Psychology, Trading Plan and Money Management plays a vital tool to consider while following the trend of the market - To be a successful trader.
- How to Trade Bank Nifty Futures?
- 12 Step-wise Trading Rules for New Traders to be Safe in the Market
Happy Trading..
Santosh, It creat many false signal… is there any filter to use this strategy.??
All is Good Screen Has pop up & Showing Aerrow on Candle Completion Close Price But How To Set With out on Candle Completion For Immeriate Crossover Price ? For All AFL Custom Indicarors
download link is not working. please send new link.
Regarding false signals in 315 strategy, you can avoid false signals by adding 2 more ema lines - say 8 ema, on high and low prices.
You will find then the prices between these 2 emas indicate a consolidation or range boundaries move. At these times avoid the trade.
In other words, go long when price is above 8 high ema, and short when price is below 8 low ema.
This will give you highest probability moving average crossover entries, and avoid false signals.
A revolutionary intraday strategy
https://www.elitetrader.com/et/threads/your-strategy-has-33-33-success-rate.311251/