Welcome to the midweek edition of The Long and the Short—a show where you can expect an honest take on trading. Something you won’t hear elsewhere. I’m Sandeep Rao.
One of the questions that I get asked very often is—Where do I get my trade ideas from?
The answer, while it may seem simple and straightforward, is seldom so.

If I think about it, ideas, especially trade ideas—don’t come from one place. Also, they rarely arrive fully formed. Usually, they start as some curiosities, patterns, or broad ideas you notice in passing, or even ideas that didn’t work earlier. Over time, these inputs start piling up and get added to my long list. I categorize them, and then they go into my idea factory.
Talking about idea generation, what matters is not the source, but how wide your surface area is—how many places you’re allowing ideas to come from—and whether you have a personal framework to filter all of this down.
The goal is not to chase every idea, but to narrow them into a small set of clear, testable hypotheses—ideas that can be defined, tested, refined, or rejected using data.
In this edition, we’ll explore where trade ideas actually come from, how to think about them, and finally, how to structure them so they’re testable.
The Four-Step Framework
Like I always do, let me start with a broad framework for where trade ideas come from and how they eventually get formalized.
Step 1: Observation
Most original ideas usually begin with an observation. You notice something in price, volatility, or market behavior.
For example, in a rising VIX environment, you might observe that in the past, spikes in VIX often cool off within a few days or a week.
At this stage, it is just an observation. You don’t know yet why it happens, how often it happens, or in which situations it fails. It’s just a pattern that has caught your attention.
This is also the first step and, in many ways, can be called foundational. Some people call this phase “induction,” a concept that goes all the way back to Aristotelian times: noticing repeated patterns and forming a general idea from them.
So that’s step one in the framework—observation.
Step 2: Explanation
The next step is what I would call “explanation.” Here, you try to understand the why and what of what you observed.
Now, obviously, not every market behavior or pattern will have a clear, logical, or satisfying explanation. But looking for causes, mechanisms, or correlations still matters. I mean, we should not stop looking for causes is what I mean, as it deepens our understanding and, more importantly, helps build conviction.
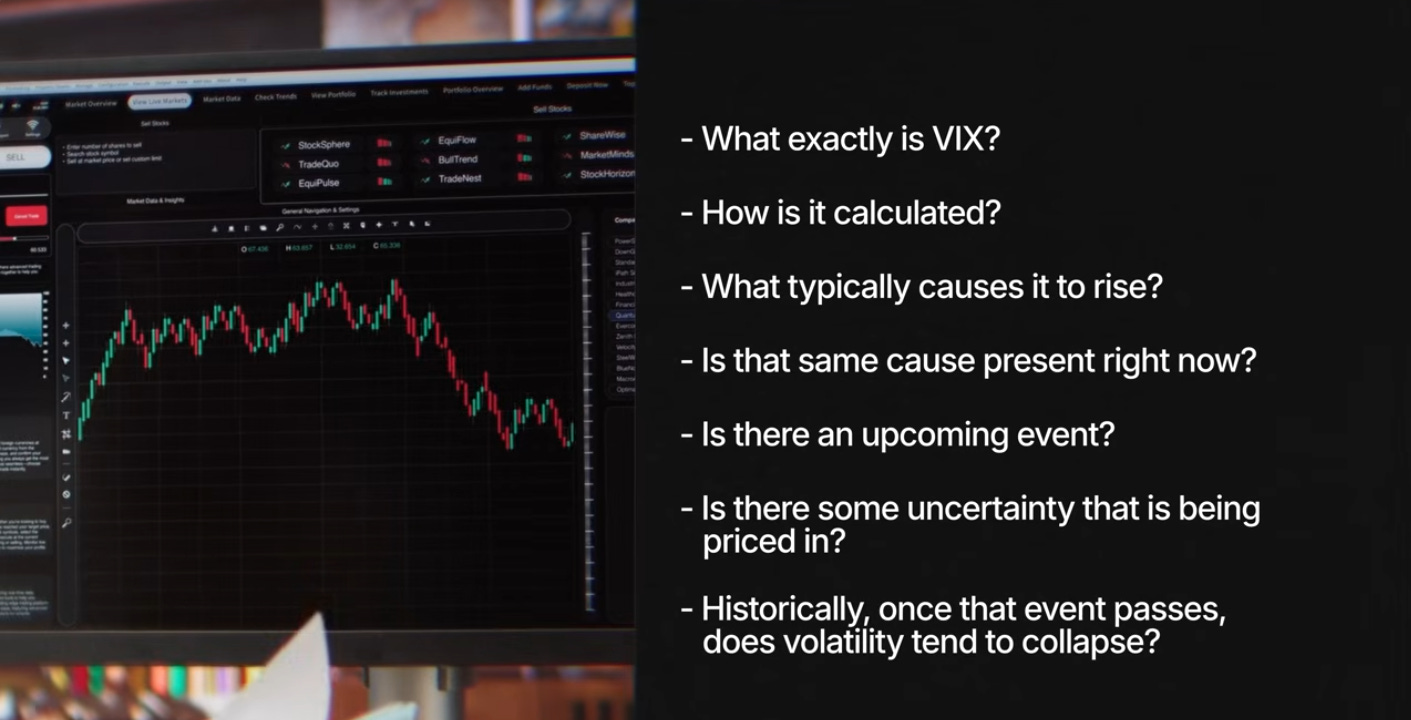
Going back to the rising VIX example—to move beyond the observation stage, you should start asking some relevant questions:
- What exactly is VIX? How is it calculated?
- What typically causes it to rise?
- Is that same cause present right now?
- Is there an upcoming event? Is there some uncertainty that is being priced in?
- And historically, once that event passes, does volatility tend to collapse?
Asking questions helps us get to the causes of a given observation.
Step 3: Falsification
Which brings us to the third step—falsification. This is something a lot of people don’t bother about. This idea is adapted from Karl Popper’s philosophy of science.
Here, instead of asking “How can I prove this idea right?”, you ask a far more important question: What would prove this idea wrong?
Falsification means asking this uncomfortable question upfront: What evidence or data do I need to prove this trade idea wrong?
In our VIX example, that could mean asking:
- When does VIX not cool off after rising?
- In what regimes does short volatility fail badly?
- What happens if uncertainty doesn’t resolve in a few days?
- Would this trade still work after factoring in costs?
Lastly, one more question, especially if the idea sounds too good to be true: If it’s so easy to make money, why isn’t everyone doing it?
The thing is, instead of looking for data that confirms our initial belief, we actively look for data that can break it and prove us wrong. We drill down into edge cases, adverse periods, and real-world costs.
Only after an idea survives this process of falsification do we move to the final step.
Step 4: Application
Back to our VIX rising example. If VIX is rising because of a known, time-bound event like the Union Budget, and if volatility has historically cooled off after similar events, then shorting volatility becomes a trade hypothesis.
Not a trade yet—but just a hypothesis that can now be defined, tested, and stress-checked.
If the idea holds up across regimes, or at least we need to be able to identify specific regimes where it works—then, and only then, does it earn the right to be traded with real capital.
Remember when I say application, I mean testing the hypothesis and not trading it.
This progression—from observation, explanation, falsification, all the way to application—is how vague market intuition slowly turns into something concrete and testable.
Now, as we move forward in this episode, keep this four-step framework in mind. Because when we talk about finding trade ideas, you’ll notice that ideas can show up at any of these stages or steps. Sometimes you’ll stumble upon a fully testable hypothesis. At other times, you’ll only have an observation, or an observation with a loose explanation. Irrespective of which form an idea comes in, your job is always the same—to move it to the next level in the framework.
That discipline—of systematically pushing ideas forward through this framework—is what makes you a systematic rules-based trader.
Increasing Your Surface Area for Ideas
With the framework done, now let’s move to different ways in which you could increase the surface area of idea generation.
Approach 1: Observation by Self
Some of the most fundamental and novel trade ideas come from simply observing data. And in markets, we’re fortunate that this data is incredibly accessible. Price charts are usually the most obvious starting point.
Charts, graphs, and data visualizations make it easier to observe behavior and spot patterns that aren’t obvious in raw numbers. Indicators can help too—especially when you apply the same indicator across many instruments and watch how behavior changes across assets, regimes, or timeframes.
I personally know several veteran traders who have a weekly ritual of going through hundreds of charts, making notes, and flagging anything that looks even mildly interesting. They are not looking at trading everything that they flagged. It’s just an observation.
Talking about charts, I think it also helps to play with different chart types. From candlesticks to point-and-figure to Heikin-Ashi—each representation highlights something different. Then one can experiment with the data itself. Ratio charts, for instance, often reveal relationships that single-instrument charts completely miss.
Next, look beyond price. Explore alternate data. Maybe there’s a story brewing in the market breadth. Maybe participation is thinning even as the index moves higher.
In other words, try multiple combinations of data sources and visualizations instead of relying on one familiar and fixed lens. At least in the initial stages of your journey.
I’ll admit, I’m a bit of a data-visualization junkie. In the seminal book on data visualization, “The Visual Display of Quantitative Information,” Edward Tufte defines graphical excellence as:
“That which gives to the viewer the greatest number of ideas in the shortest time with the least ink in the smallest space.”
That line has stayed with me, and hence I keep looking for better and better ways to visualize data.
Long story short—look at as many data visualizations as possible. But don’t just see them. Observe them. If you stay curious long enough, you’ll start noticing things others may overlook.
And as a quick aside—if you’re curious about where the charts we take for granted actually came from, look up William Playfair—he’s the man credited with inventing many of the chart types we still use today.
Approach 2: Borrowing Other’s Observations
While observing by oneself is a great way to get ideas, there are limits to it. This is where our next approach comes in—what I would call borrowing other’s observations.
No harm in borrowing ideas from others. The internet is full of them, but there is a lot of noise as well, so unless you curate the list of people from whom you want to borrow, it gets unmanageable.
Also, the best ideas rarely come packaged as clickbait. It’s usually not a video titled “Best EMA crossover with 100% win rate.”
Instead, real insight often shows up in passing, hidden in a remark. A side comment by the guest in a podcast. A throwaway line in an explainer video, or sometimes even within comments by viewers.
For example, someone might casually mention that pairing a long-term moving average with a short-term one can help reduce whipsaws. That’s an insight. And insights are where good hypotheses begin.
This is also where being part of an active community of serious traders really helps. You get exposed to other people’s observations and ideas—and that can dramatically shorten your own idea-generation cycle.
There’s only so much you can discover on your own. I really think borrowing others’ observations and testing them out can be a superpower.
Approach 3: Borrowing Hypotheses or Setups
That brings us to our third approach of idea generation. I’ll call it borrowing hypotheses or setups.
So far, we’ve spoken about generating ideas either through your own observations or by borrowing observations from others. Sometimes, though, you can go one step further and borrow a fully formed trading setup itself.
One of my go-to sources for this is academic research. That said, academic papers are only useful if you know how to navigate through them. You need the right keywords to search. If you are new, you can use LLMs to help you articulate what exactly you’re looking for—and that often makes the search far more efficient.
Another hack that I use is to follow the references within a paper. For example, if you come across a paper studying something like the January effect in equity indices, don’t stop there. Look at the other papers it cites. Often, you’ll find related work that tests similar ideas across different markets, time periods, or uses different methodologies.
This kind of reference-hopping is surprisingly effective. Many of the strongest trade ideas I’ve worked on didn’t come from a single paper, but from connecting insights across multiple studies.
For academic papers, some key sources that have worked well for me are Google Scholar, SSRN, and arXiv. There are several others as well. Here is the curated list.
These platforms are useful if you’re looking for ideas that are already framed as hypotheses or tests. And again, I repeat, knowing the right keywords—or using LLMs to help refine what you’re searching for—makes a big difference.
Next in line are books and blogs written by traders and money managers. One of the earliest books from which I picked up concrete trading ideas to test was “Long-Term Secrets to Short-Term Trading” by Larry Williams. I also explored narrow-range ideas from Toby Crabel’s work.
Later, I found “Advanced Trading Strategies” by Rob Carver particularly useful—not just because it hands you ready-made strategies, but it also teaches you how to think about building and testing strategies.
All of this isn’t meant to be a definitive reading list. I am just trying to make a broader point that well-written books can be excellent sources of testable ideas. The same applies to blogs. For instance, Quantifiable Edges by Rob Hanna is a great source of simple, clearly articulated ideas that lend themselves well to testing.
Talking about other sources for borrowing ideas—YouTube and podcasts are also great sources where you can pick up ideas. There are many videos, explainers, and podcasts where some great ideas are shared, be it India-specific or the ones that work in other markets.
As always, our focus should be on getting ideas and testing them, not following them blindly. With embedded AI-based summaries available on YouTube, the task of getting a video summary becomes very easy, so you don’t have to waste time listening to all of the conversation.
When searching for ideas, it’s good to be a bit specific, at least in terms of broad categories. You should know what you are looking for—Trend following ideas, Mean Reversion ideas, Short Volatility ideas, etc. This is also where an understanding of basic types of strategies would help. Do look at episode five of the Long & the Short series if you have not:

A Word of Caution: Beware of Crowding
So far, we’ve spoken about a framework for working with trade ideas, and the various sources from which those ideas—and sometimes even ready-made hypotheses—can come from.
But here’s an important word of caution.
Certain trading strategies can fall prey to a phenomenon called crowding. When too many participants start trading the same idea, the edge tends to erode—and in some cases, can disappear entirely.
So you have to be skeptical of what’s easily and widely available in the public domain. For all you know, a strategy may be circulating precisely because its best days are already behind it.
Another thing I’ve learned from interacting with veteran traders and hedge fund managers is this: they will never reveal the full, last-mile mechanics of their strategies. And that makes perfect sense—why would they?

At best, what you’ll usually get is a broad framework, not the exact rules, filters, risk management parameters, or execution nuances that actually make the strategy work.
So when you come across a strategy online, assume there’s more going on beneath the surface than what’s being described. You cannot just blindly copy stuff.
Your job is to test the idea, break it, refine it, and adapt it—until it becomes something robust, contextual, and deployable for you. That’s how borrowed ideas turn into trading strategies with real edges.
Book Recommendation
Before I close, if the meta of this “idea generation space” interests you, I have a solid book recommendation for you: “Where Good Ideas Come From” by Steven Johnson.
It’s an eye-opening exploration about ideas and how they are formed and come to be. It also busts a lot of myths and misconceptions along the way.
Closing Thoughts
That brings me to the end of this newsletter on how to find trade ideas.
We explored about where ideas really come from—observation, borrowing from others, data, research, and conversations—and more importantly, how to systematically move them from vague intuition to structured, testable hypotheses.
So the next time you come across a trade idea—whether it’s something you noticed on a chart, heard in passing on a podcast, or read in a paper or blog—you know what to do. Obviously, you cannot rush to trade it from the next day.
Ask where it sits in the framework, what could go wrong with it, and whether it’s actually testable. And if it is, figure out ways to test it.
That’s pretty much on this topic. If you found this edition useful, do consider subscribing to the channel—it really helps.
I’ll be back soon with the next one.