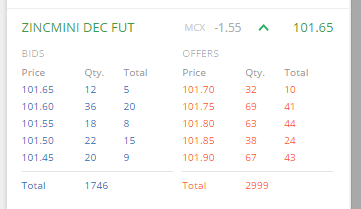
.I want to understand Market depth data... For example,what does the following market depth indicates? There are considerably more sellers than buyers? Can I take short position here(after confirming with other indicators)? or it is other way round? Please help me understanding market depth...
In other words, how can I effectively utilize this market depth data during day trading?
Hi
Can you please explain how this market depth is interpreted. The previous close was .40. There wasn’t any trade in the morning, but the LTP is .60, which is almost 50% higher. Cannot understand this.
Thanks
The price you’re seeing is yesterday’s settlement price. For illiquid contracts, if there are no trades in the last 30 minutes of the trading session, the exchange will provide a theoretical settlement price. As you can see in the market depth snapshot, the last traded time is 14:39 on the 21st of April. You can check out more details on this here.