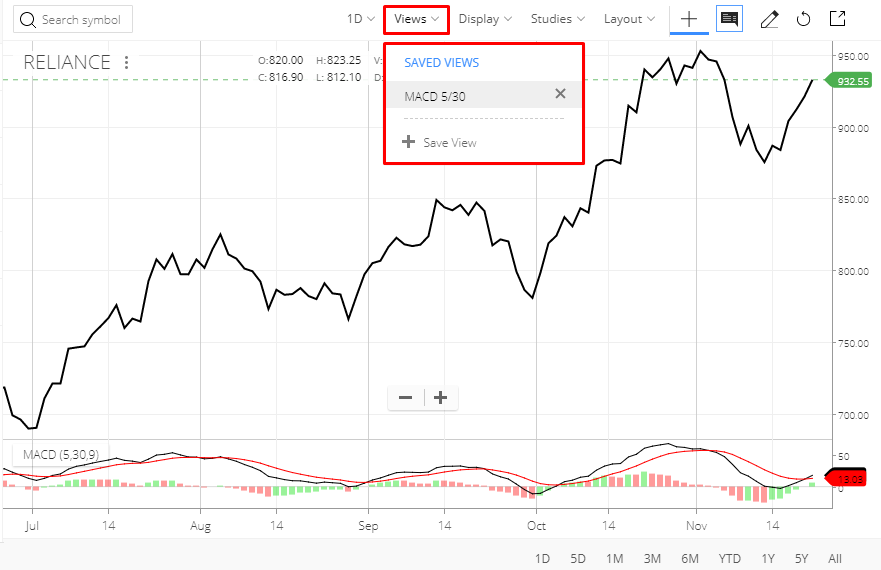
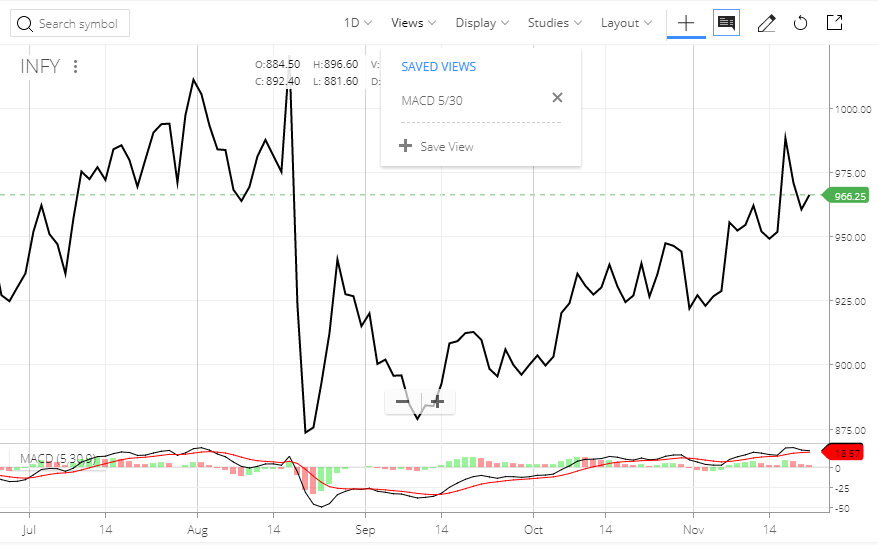
You know for every stock you are adding various tread graphs, If there a way to save the action as a template. For the example. MCAD 30 days average and 5 days average as template1…
So when you open a new scipt you will just add template1, template2 etc. ?
Thank you, I found it. But I don’t like using the Kite, as the data is not real time. Even PI shows the difference… Do you know if it is any better in Kite3… real-time price, candles, charts etc