I usually look at the daily and 1 hour chart side-by-side every day if I want to see a new stock, I have to first pop out the window and then change the display 2 charts so that I can look at the daily and 1 hour chart side-by-side. Is there any way that Kite web 3 from zerodha can show by default 2 charts side-by-side.or better still, if there is any way to always see the charts in a form of window and the default view is 2 charts?
Thanks for any inputs
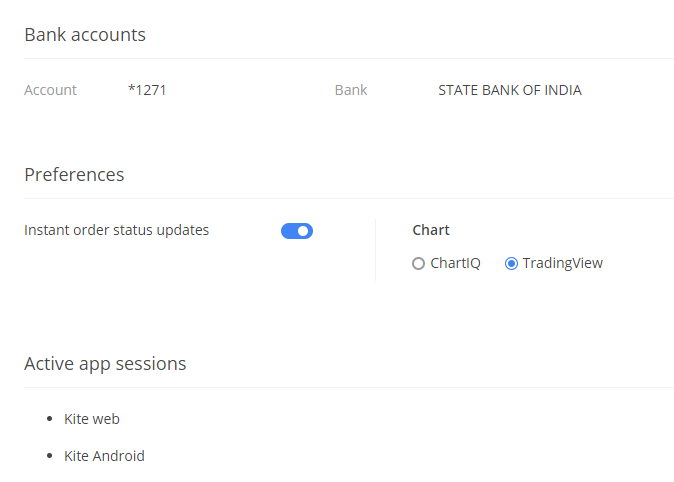
You can use multiple charts available in TradingView on kite web, to set the chart preferences to tradingView click on your id from right top corner from dashboard and go to profile (Kite - Zerodha's fast and elegant flagship trading platform) and switch the radio button from ChartiQ to TradingView under preferences
open the chart and select the layout from right top of chart menu
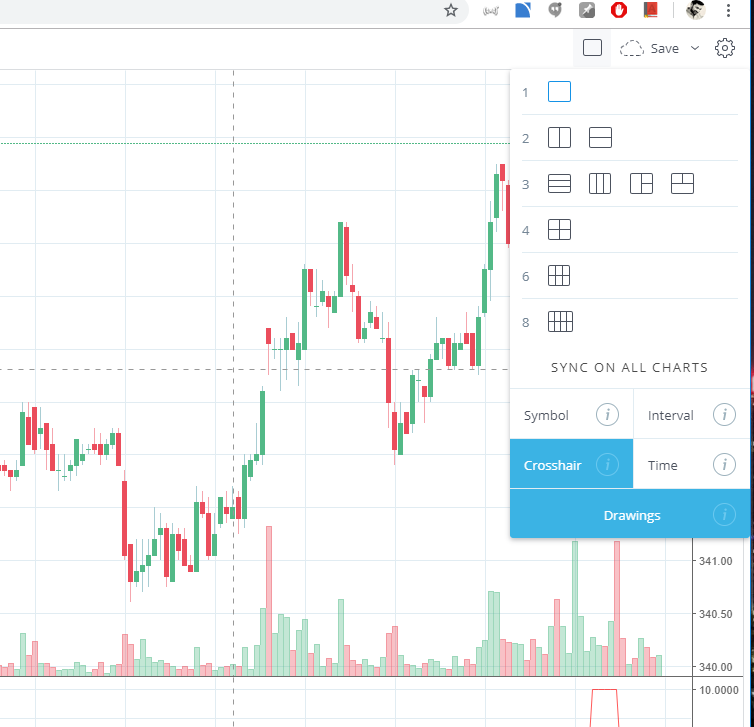
and can add the charts for two or more different scrip as per layout selected
you can also save the layout from the save layout option and can load it.
1 Like
Thank you for the prompt response. I tried the TradingView.com solution as you had mentioned. It is not exactly working the way I was hoping it to work. It is still better than the early years solution. In case if there is anyone else looking at this thread later, for the sake of the record, even after saving the two windows as the default template, if I tried to open the chart of another stock, it will always open only a single window and after that I will have to change the layout once again by going to one of the same layouts. It is still better than the earlier version. What I was hoping was that whenever I try to view the chart of a particular stock, it will show me the 1 of chart in one windows and one-day chart in another window instead of me having to separately load the charts.
Thank you again for the prompt response
Hi @rvsw,
As far as i know, i don’t think what you are asking is possible now in Kite. But, below is a one-time workaround with TV charts on Kite which might help if you have the stocks already added to your marketwatch.
- Pop-out any chart to new tab.
- Select 2 chart layout and also the “Sync Symbol” option just below it.
- Select the timeframes you want on each chart
- Save the chart layout.
- Now, when you click on any of the two charts and change the symbol at top-left corner, it will change symbol on both scripts.
Note that you would have to load the chart layout manually atleast once, maybe at the start of your day.
And, don’t close the tab in which you have opened the chart.
If you do, you will have to pop-out the chart again and just load the layout you had saved.
This would not be exactly what you are looking for, but might be helpful.