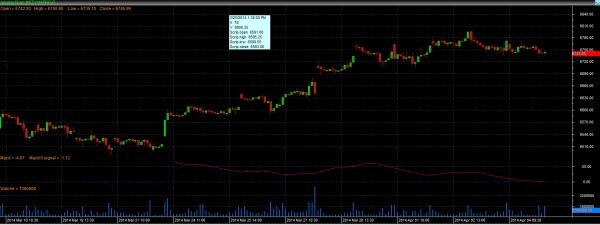
MACD is basically the difference of 2 moving averages.
By default the averages in Zerodha Trader are (13-day EMA, 26-day EMA)
There is a signal line which is the average of MACD line,default value for it is 9.
Red line is the average of MACD and Blue line is the actual MACD. The most common way of using MACD is signal line crossovers, ie When MACD lines crosses above the signal line it is a bullish crossover and if it crosses below the signal line it is a bearish crossover.
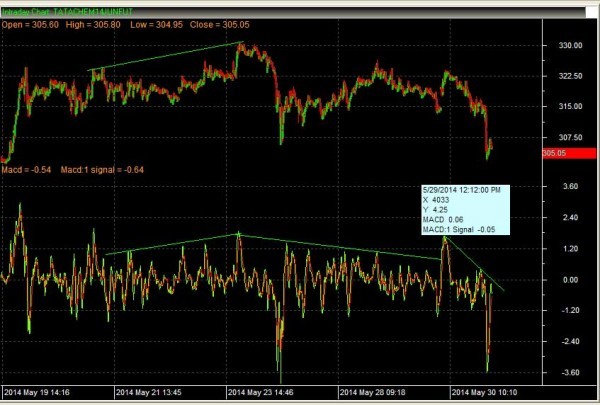
The above is the image of Tata Chemicals Jun26th future.
I have added a couple of Horizontal trend lines on both the price chart as well as MACD chart. MACD provides two kinds of trends, short term as long term. Each time MACD lines crosses over signal line, it gives a buying opp and when it crosses down, it gives a selling opp. But when each time it goes crosses down at a higher point than the previous one, the price shows a upward trend and vice versa.
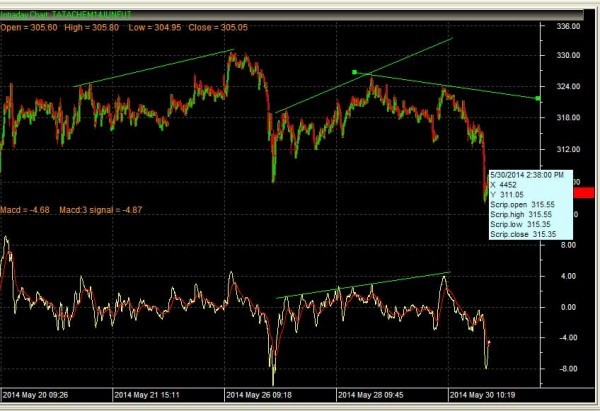
The same scrip but with a third trend line added
In this image I have added (had to) two trend lines on the price chart in comparison to only one in the MACD chart. This is because the price started to trend down. You can see lack of momentum to push the price further up.
Another method of using MACD is divergence. Price makes a new high and MACD fails to make a new high. This is bearish divergence. Bullish divergence is when price makes a new low and MACD fails to make new low.
Like other oscillators it works best in trading ranges.
 - bse2nse.com")