Just saw supertrend indicator on https://kite.zerodha.com/. I have heard on a lot of forums about this, but don't know how to use this. Can anyone explain?
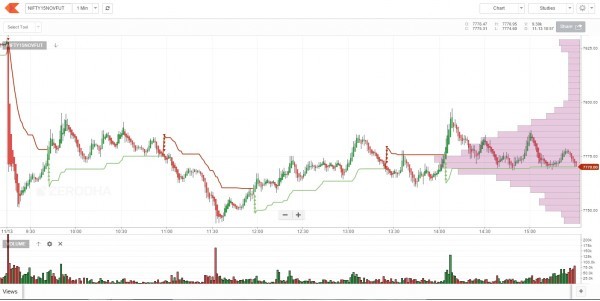
Just saw supertrend indicator on https://kite.zerodha.com/. I have heard on a lot of forums about this, but don't know how to use this. Can anyone explain?
The super trend indicator like all trending indicators it works well in trending market like in uptrends and downtrends ,the Buy and Sell signal changes as soon as the indicator flips over the closing price. When the Supertrend closes below the Price, a Buy signal is generated, and when the Supertrend closes above the Price, a Sell signal is generated.
Before understanding the supertrend indicator, understanding the ATR is necessary as super trend employs ATR values to calculate the indicator values. I'll assume you know ATR and how to use the same.
The supertrend indicator is plotted over the price chart of the stock or the index. The indicator line changes its color between green and red based on the price moment in the underlying. Super trend does not predict the direction, rather once the direction is established it will guide you to initiate a position and suggests you to stay in the position till the trend sustains.
What should you know?
On Kite:
When you select Supertrend indicator from the list of studies you will be prompted for two inputs – Period and Multiplier.
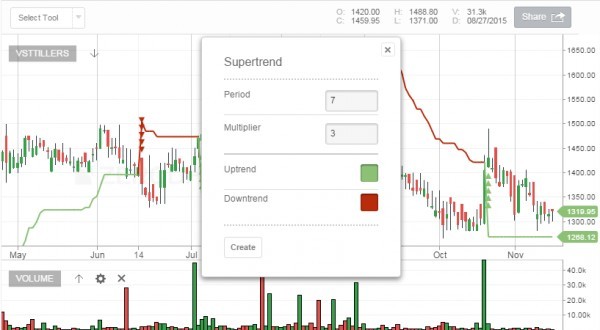
Period refers to the ATR number of days. The default value on Kite is 7, which means to say that the system will calculate the ATR value for the last 7 days. You can input any value you deem suitable.
The multiplier refers to a value by which the ATR will get multiplied. The default value on Kite is 3, so whatever is the value of ATR, it will get multiplied by 3. Multiplier is a crucial input for Super trend. If the multiplier value is too high, then lesser number of signals are generated. Likewise if the multiplier value is too small, then the frequency of signals increase, hence chances of generating false trading signals are quite high. I would suggest you keep this value between 3 and 4.
Once the indicator is plotted, this is how it appears on the chart –
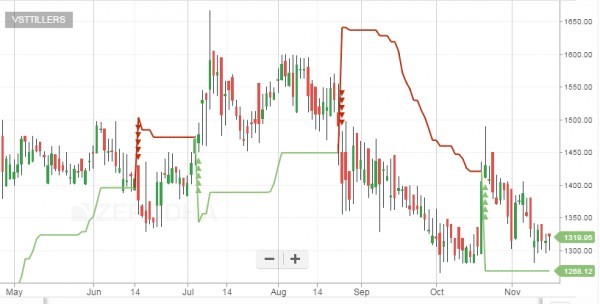
Notice how the indicator changes the color as the price moves. Also, whenever the buy/sell signal is generated green and red arrows are generated (respectively) prompting the trader to go long/short on the stock.
Good luck and stay profitable!
The Supertrend indicator was created by Olivier Seban. He suggests not to take position immediately after a change of direction, but rather during a consolidation period where the indicator gets flat. Supertrend is a trend following indicator and when it changes direction it doesn't mean that a new trend is starting.
So according to this, I would suggest to put pending orders as soon as the Supertrend line gets horizontal:
Also, one way to confirm if there is a trend is to check if price is on the same side of Supertrend on the next higher timeframe.
With all those considerations, that strategy should be a winner overall despite a few losses. Supertrend helps catch the big moves and if applied on more than one financial instrument with proper money management, it is likely to give positive results all the time.
I saw a study on the web suggesting to use a 9 period and 7.9 multiplier, but I would rather use a multiplier between 2.0 and 3.0. That would give less space between price and the Supertrend line wich can be used as a stop loss level.
Sir, does this indicator kinda repaints ? if yes is there anyway to turn it into a non repainting one on kite ?