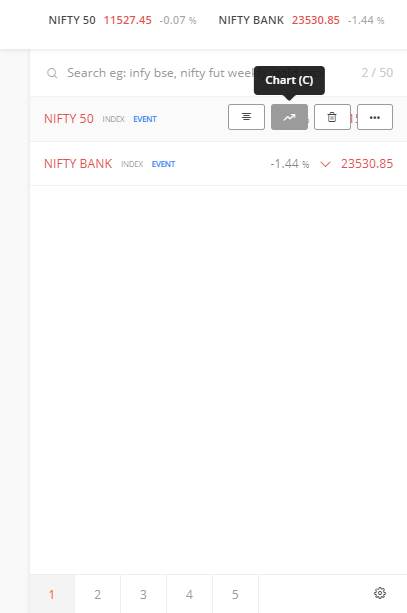
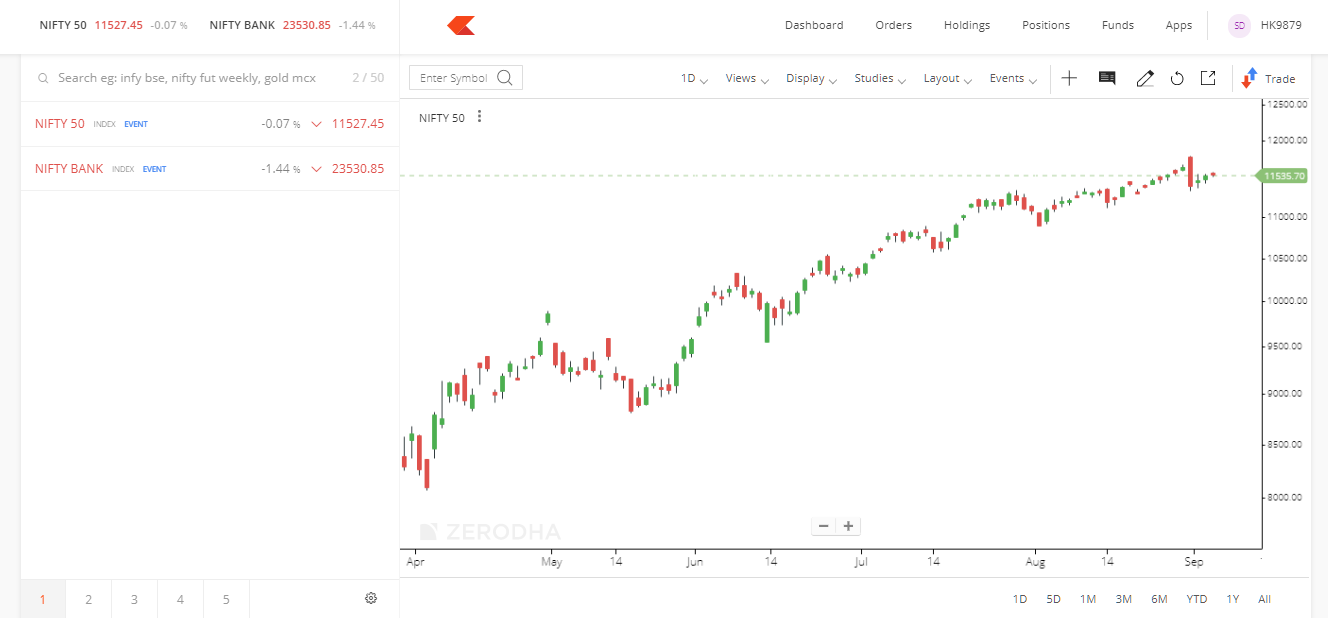
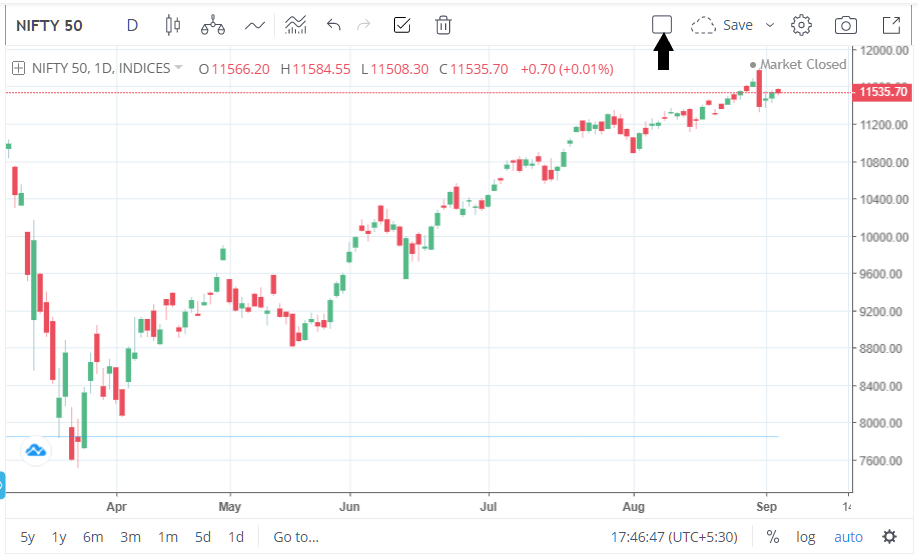
On Kite, you can view multiple charts for indices, to do so add the Index you want to view a chart of to Kite watchlist and when you hover over the scrip you will be able to view the chart.
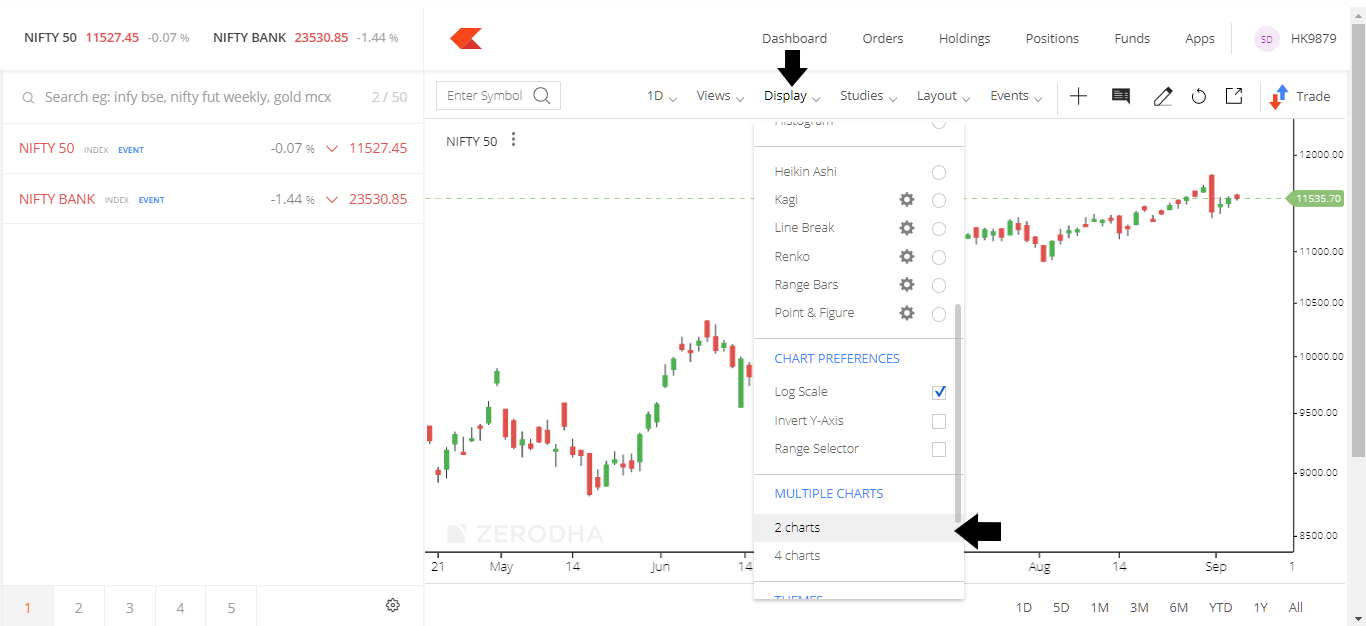
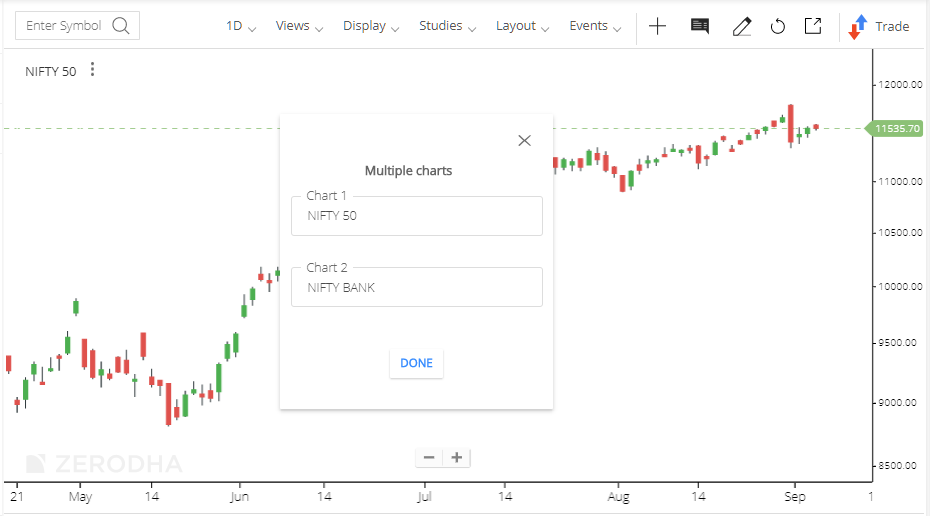
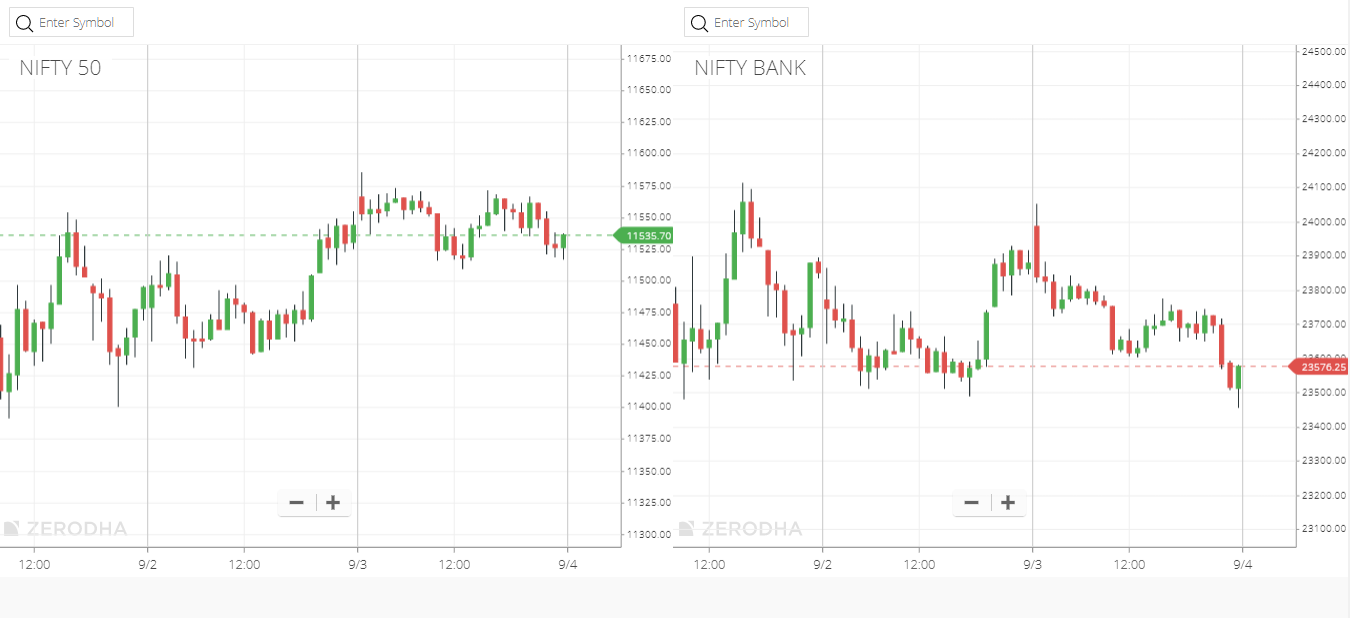
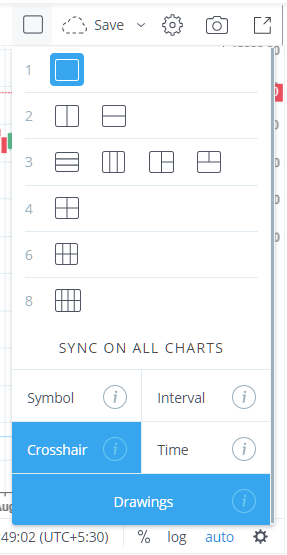
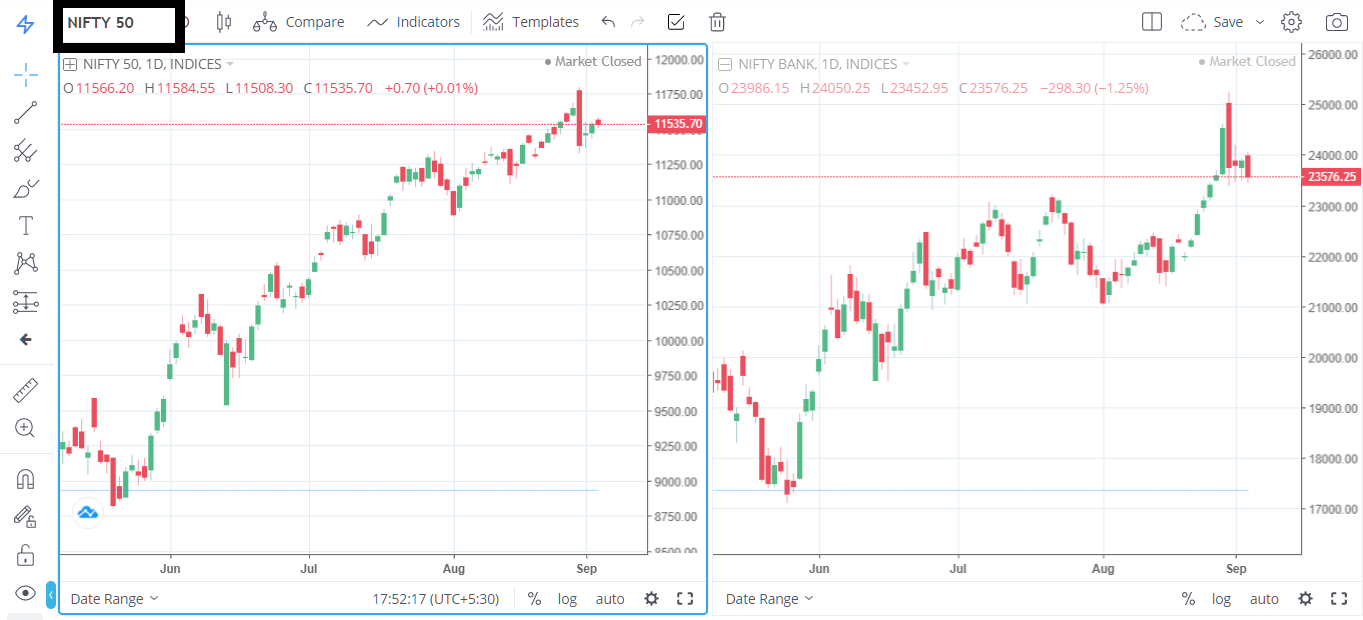
Once you have done this, to view multiple charts side by side, on ChartIQ you can do so by going to Display > Multiple Charts, you can either select layout of 2 charts or 4 charts.
Hi @ShubhS9 , When open any chart and zoom in through mouse roller, it works. But open 2 or 4 charts and zoom in, it zooms out. Same for zoom out in single chart, zooms in in multiple chart. Why this and whats any fix?
Single chart and multi-layout charts are on different versions. We’re working on updating multi-layout charts to a newer version, this will be resolved in it.