I built a market intelligence tool for Nifty traders - here's the problem that made me start

I have been building a market intelligence platform for Nifty traders for the past 8 months. Here is the problem that made me start.

I kept losing money not because my setups were wrong, but because I was using the right strategy in the wrong market condition.

A momentum trade that works beautifully in a trending session destroys you in a compression or ranging market. A mean-reversion trade that works in chop gets crushed the moment the market starts trending. Most of us know this intellectually, but in the heat of the moment - especially during Nifty F&O sessions - it is very hard to step back and ask “what kind of market is this actually?”

I was looking at OI data, PCR, VIX, price action - all in separate tabs, trying to mentally synthesize what the market was doing before placing a trade. It was exhausting and inconsistent. And I kept getting it wrong.

So I started building something to answer one question before anything else: what is the market doing right now, and how clean is that signal?

The core of what I built is regime classification - reading the market across six timeframes and identifying whether you are in a trending, volatile, ranging, compression, or transitional environment at any given moment. It also scores how clean and tradeable that regime is, so you are not just getting a label but a confidence level behind it.

On top of that it layers options data, dealer positioning, futures flow, breadth, and an AI interpretation layer that puts it all together in plain English - so you are not staring at 10 numbers trying to figure out what they mean together.

Two things I use every single day personally: a pre-market brief that goes out before the session opens - covers global context, key levels, and what the data says about the day ahead. And during the session, a live AI brief that updates every 15 minutes as conditions change. The other thing that has been genuinely useful is a market memory feature - it looks at the current session’s characteristics and finds the most similar historical sessions, so you can see how those played out.

The part I am most excited about right now: I am building an AI layer on top that watches the market every single day, absorbs everything - price, options flow, breadth, regime, institutional data - and starts making its own decisions about what conditions matter. No manual input from my side. Still in closed testing but this is where most of my energy is going.

My actual question for this community:

How do you currently decide what type of market you are in before you trade? Do you have a structured process, or is it intuition built over years? And has trading the wrong strategy for the market condition cost you meaningfully?

I am still building and the more I understand how experienced traders think about this, the better the tool gets.

1 Like

What caught my attention was this.

For Intraday assessment of the sentiment, I usually stick to this checklist. If Nifty50 has a 15 min candle close above Yesterday’s Range, its a bullish outlook for me, a 15 min candle close below Yesterday’s Range is a Bearish Outlook for the rest of my decisions for the day.

That is a clean and simple rule - and the fact that it is consistent is probably what makes it work. Most traders fail not because their method is wrong but because they keep changing it session to session.

The 15min candle relative to yesterday’s range is essentially a structure break check - you are asking whether today has accepted above or below prior value before committing to a direction. That is solid market logic.

What I found myself wanting on top of that was the “what kind of day is this likely to be” question answered before I even looked at price. Because a bullish structure break in a trending regime behaves very differently from the same break on a compression day or an expiry day where gamma is running everything.

So what I built layers a few more reads on top of what you are describing - things like volume profile shape for the session (whether it is forming a D shape, a P shape, or a trend day), VWAP band positioning, where the gamma flip strike is relative to spot, and how dealer positioning is set up. All of it trying to answer whether the structure break you are seeing has fuel behind it or is likely to reverse.

The part that surprised me most was how much session character changes around expiry vs non-expiry days. The same setup has very different follow-through depending on that context alone.

Curious - do you adjust your checklist at all on expiry days or do you apply the same rule?

1 Like

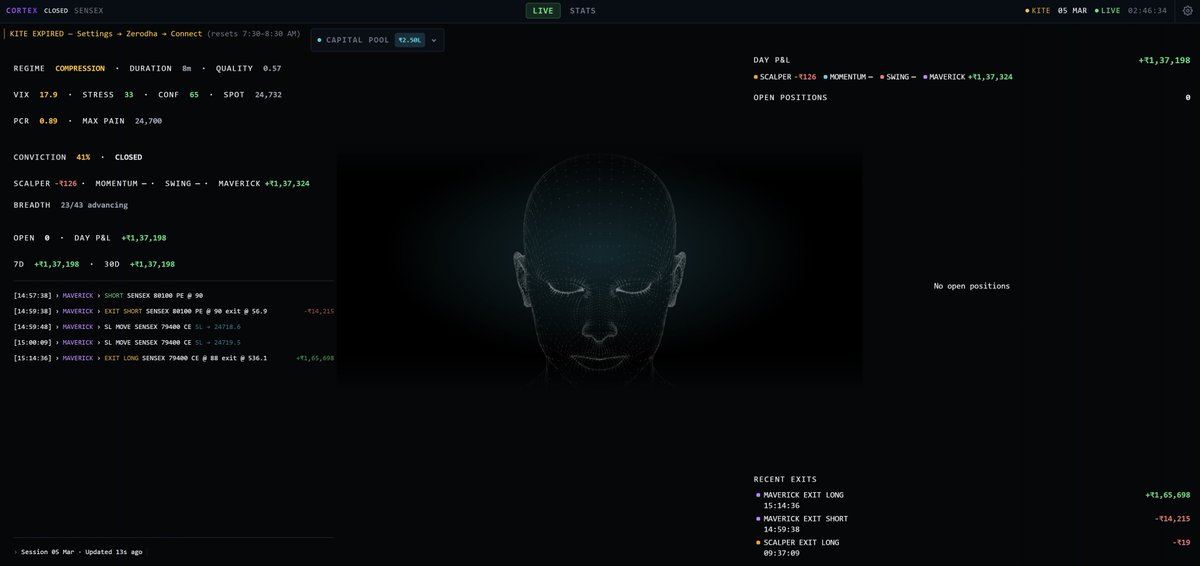
Putting Cortex on public record.

Live performance page - open to anyone, no login needed. Updated in real time.

Not sharing my personal Zerodha link. That has my name on it. This is the AI’s track record, not mine.

No human intervention. No cherry-picked results. 6 months. Let the data speak.

niftydesk.app/live/cortex

What Project Cortex does every session -

Before the open, it reads market context and generates a plan per persona.

During the session, it processes price structure, options positioning, volatility, breadth, and confluence data - updated every few seconds.

For every trade, it generates a reasoning narrative before entry and after exit. End of day, it writes a session summary.

All data comes from NiftyDesk (niftydesk.app) - the same intelligence the platform serves to traders, now feeding an AI that acts on it.

Every decision is logged. Nothing is hidden.

I’m not a big-capital trader running complex strategies. If I see a good opportunity with the capital I have, I take the trade.

On days when I want a bit more confirmation, I also check the 15-minute RSI to see if it aligns with my view, typically between 60–90 for bullish setups and around 40–10 when looking to initiate bearish trades.

What charges/slippage have you included?

That is a solid approach - keeping it simple and letting RSI confirm your directional bias. On expiry days, the regime classification actually becomes more useful because things shift faster. Compression can snap into a trend in minutes. The tool flags these transitions in real time, so you are not caught off guard. But honestly, for someone trading with a clear setup and confirmation like you described, the biggest value would be the regime score telling you “this is a clean trend day, press harder” vs “this is choppy, stay small or sit out.”

1 Like

It’s clean and clearly crafted, showing it was built by someone genuinely committed to the project.

The subscription rates, though, here’s the challenge. As a developer, how do you justify that price to an audience that’s extremely sharp in the field ( assuming most of the rest are on live YouTube streams hunting for free ideas) and who could realistically build something similar in under an hour? Convincing them to pay a premium is definitely not easy.

The backtesting engine applies a fixed slippage assumption per trade. On the live execution side, actual charges are estimated and deducted from P&L - brokerage, STT, exchange transaction fees, stamp duty, and GST at current NSE rates. Every trade is logged with entry/exit prices. Honest caveat: the backtester itself does not deduct charges yet, so backtest results are pre-cost. That is something I plan to tighten up.

Please do. Depending on the strategy (high frequency), there could be an annual pnl difference of 30% or more

Appreciate the kind words on the craft. On pricing — fair pushback. The audience here is sharp, no doubt. But “building something similar in under an hour” — I would genuinely love to see that. Six-timeframe regime classification, live options flow synthesis, market memory matching against historical sessions, pre-market briefs, and a 15-minute live AI update cycle — this is 8 months of full-time work and still going. That said, I hear you on pricing. I am still figuring out the right balance and am open to feedback on what feels fair for the value delivered.

1 Like

You’re right about the reality, but in the age of vibe coding, the first thought many people have is, ‘I can do that for free using this AI agent or that AI Agent.’ That mindset can become a real obstacle for developers trying to get users to take action and pay for a subscription.

Unless a dynamic pricing model is created—one that even vibe coders see as a fair deal—this problem will persist. Trade-tech products need a new, smarter pricing approach.

I think no one has really cracked a good pricing model for trade tech products yet. The usual one-size-fits-all monthly subscriptions feel unfair—charging even for Saturdays, Sundays, the two expiry days (when many traders prefer to sit out), and other holidays ends up shortchanging retail traders.

What’s needed is a dynamic, position-based pricing model. For example, users could top up an account like a Fastag, and at the end of the day a percentage of their wallet balance goes to the developer.

This way, they only pay on the days they actually take a trade, while developers still get a fair share. On losing days, there’s no charge.

It might sound a bit unusual, but this could be the future of trading software pricing.

That model makes sense for execution platforms. But NiftyDesk is an intelligence layer - there is no trade execution in the subscription. The value is in the data synthesis happening before you decide whether to trade. Features like market memory match today’s session against historical patterns so you know how similar setups played out. One avoided bad trade in a month already pays for the subscription.

1 Like