Our goal with The Daily Brief is to simplify the biggest stories in the Indian markets and help you understand what they mean. We won’t just tell you what happened, but why and how too. We do this show in both formats: video and audio. This piece curates the stories that we talk about.
You can listen to the podcast on Spotify, Apple Podcasts, or wherever you get your podcasts and videos on YouTube. You can also watch The Daily Brief in Hindi.
In today’s edition of The Daily Brief:
- India’s Inflation Softens to 4.3%
- Gold prices hit the roof
India’s Inflation Softens to 4.3%
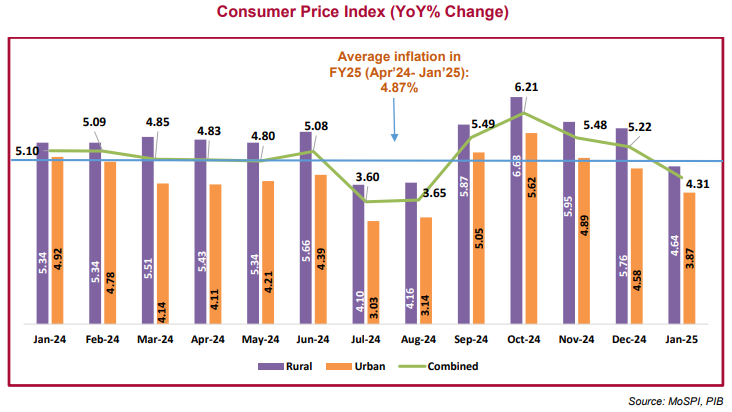
The government just released inflation data for January: and there’s some good news. Headline Consumer Price Index (CPI) inflation cooled to 4.3% , year-on-year in January 2025, down from 5.2% year-on-year a month ago. This is a five-month low. This was slightly below many analysts’ estimates, which suggests that pricing pressures have fallen faster than most people expected.
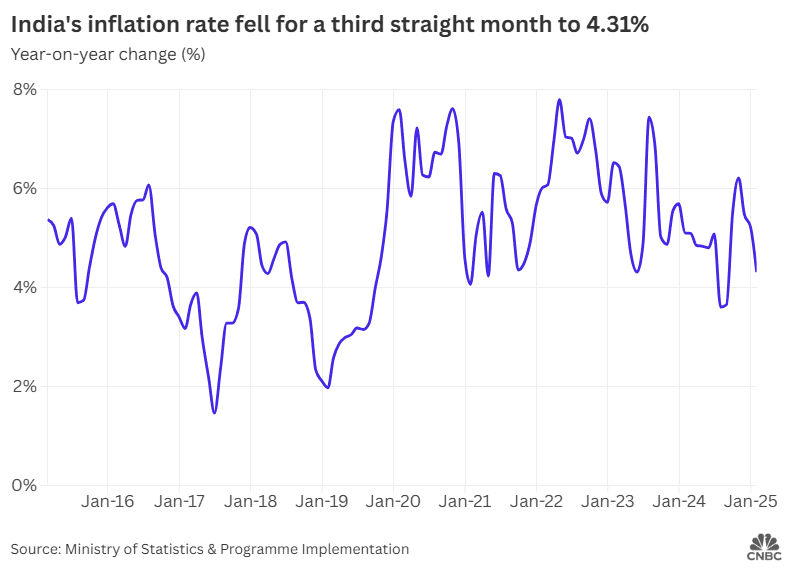
Source: CNBC
Of course, inflation is deeply complex. While a single headline figure gives you an extremely broad, directional sense of how prices are moving, there’s a lot more that’s happening under the hood. So, today, we bring you five deeper threads to pull at, behind the headline inflation figure.
1. RBI makes the right call
At its meeting earlier this month, the RBI was in a tough spot. On one hand, India’s economy was evidently running out of steam — as GDP figures trended downwards, while consumption had clearly fallen. At the same time, its primary job is to keep inflation as close to 4% as it could, and December’s 5.2% inflation rate made it hard to justify too big an interest rate cut.
Ultimately, the RBI went for a small repo rate cut of 25 basis points, trusting projections that food inflation would come down. With January’s inflation print coming in at 4.3%, it’s probably breathing easy. January’s numbers confirm the downward trend in food inflation — perhaps even undershooting what economists had anticipated.
Source: RBI
Meanwhile, there are indications that its rate cut couldn’t have come too early. As we’ll see shortly, along with the drop in inflation, overall industrial activity too has declined. RBI’s call to support the growth of the Indian economy was clearly the right one.
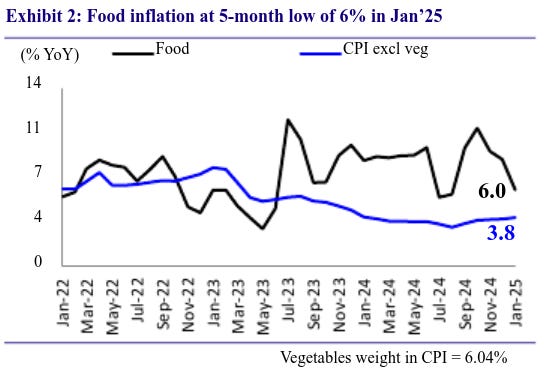
2. Softening food inflation
So, why was there such a drop in inflation? The big reason, evidently, is a sharp fall in the price of food and beverages. Roughly speaking, food and beverages make up half of India’s CPI basket. So, when their prices move, that makes a big difference to our inflation. In January, this sub-component eased considerably: falling from 8.4% year-on-year in December to 6% year-on-year in January — the lowest in five months. This helped pull our overall inflation rate lower.
Source: Motilal Oswal
Digging deeper, here’s how individual items fared:
-
Vegetables: The most dramatic fall came in the price of vegetables. Vegetable inflation dropped from around 26.6% to 11.3–11.4%. A good harvest this winter played a large role. And this is likely to continue — high-frequency indicators show that key vegetables, like tomatoes, continued to pour into markets in February. This might hint at a further cooldown.
-
Cereals & Pulses: Inflation in cereals and pulses is at a multi-year low, aided by higher sowing this winter, and enough water in Indian reservoirs.
-
Eggs: Eggs posted the slowest price increase in more than two years, reflecting stable supply and seasonal demand shifts.
-
Edible Oils: One cause of concern — an exception to the overall downturn — edible oils climbed to 15.6%. Things might get worse still. Within India, oilseeds are being sowed less than before (down 1.8% year on year), while customs duty hikes have made imports more expensive.
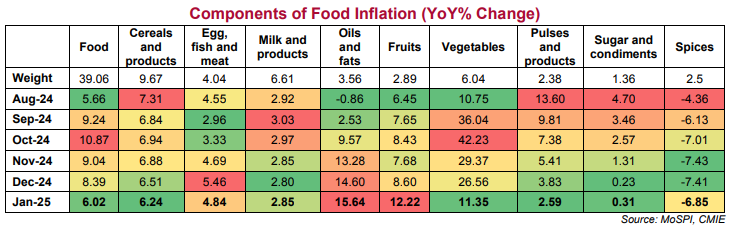
Source: PNB
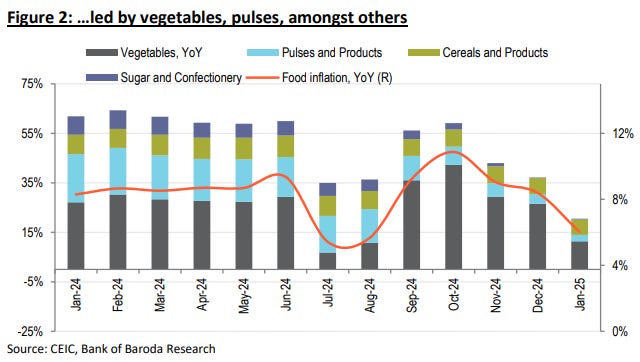
Source: Bank of Baroda
All in all, while food inflation has come down, giving welcome respite to households, the price of edible oils may soon become a worry.
3. Core inflation and external dynamics
Once you remove the most chaotic items from the picture, things look very different.

Source: Motilal Oswal
‘Core inflation’ — that is, inflation in everything other than food and fuel, where prices are always highly volatile — stayed around 3.7% year-on-year in January. This is relatively subdued — but it has been in this range for the better part of a year.
It’s unlikely that core inflation will drop further anytime soon because there are many risks on the horizon — particularly when you look at the things we import. For a long time, falling commodity prices had dragged our inflation down. But this cushion provided by cheap imports appears to be waning. In fact, the prices of certain metals and other commodities appear to have bottomed out.
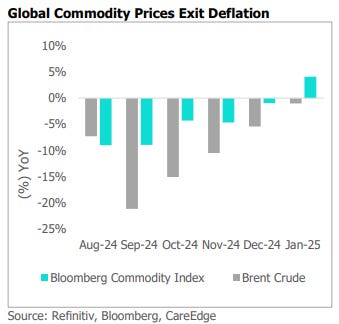
Source: CareEdge Ratings
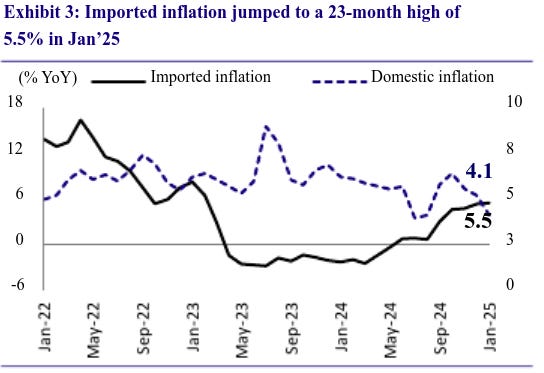
Meanwhile, the Rupee has depreciated by ~4% in the second half of this financial year, even as global trade uncertainties rise. Because of this, our imported inflation could tick up. We’re already seeing signs of this play out — imported inflation increased to a 23-month high of 5.5% in January. Things could get worse if countries start placing a new round of tariffs.
Source: Motilal Oswal
4. Urban-Rural Divergence and Core Components
We’ve spent a long time on this newsletter talking about how urban consumption has been falling, while rural consumption has stabilised things somewhat. There’s more evidence of this in the inflation data.
Source: PNB
In January, urban CPI slipped to 3.87%, even as rural CPI came in at a relatively higher 4.64%. To some extent, this is natural — as you can see in the above graph. Cities typically have better distribution networks, and price improvements often show up sooner in cities before they reach elsewhere.
Even so, there’s a mounting body of evidence that urban consumers are becoming more cautious and circumspect — as income growth has stagnated, even as prices continue to rise. Rural India, meanwhile, has remained a bright spot for our economy. This may have contributed to the persisting difference we’re seeing in inflation rates.
5. Inflation and industrial output
While prices have dropped, there’s some worse news as well — India’s industrial output growth has slipped considerably. India’s ‘Index of Industrial Production’ (IIP) went down from 5.0% in November to 3.2% in December.
Our lower industrial output owes itself to a slowdown in manufacturing.
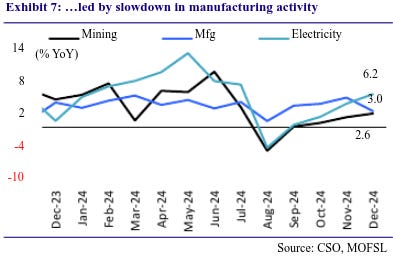
Source: Motilal Oswal
In fact, a quarter of India’s manufacturing sector contracted in December.
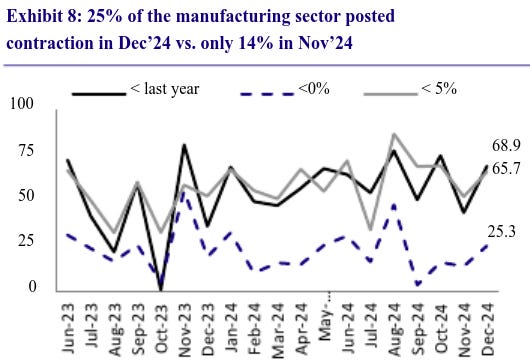
Source: Motilal Oswal
Inflation and industrial production are connected. When people consume willingly, prices go up — but that also pushes up demand for investment. Conversely, when demand growth falters, inflation often slows — but that’s bad news for industry. So our easing inflation may, in part, be a bad thing. It may reflect weak demand.
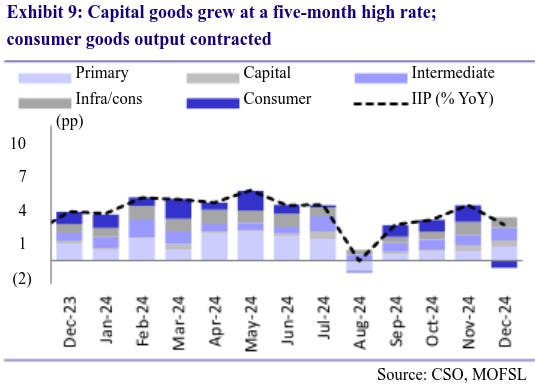
Source: Motilal Oswal
This is certainly what the data suggests. Within Indian manufacturing, it’s consumer goods that took the biggest hit — with the segment contracting by 2.1% year-on-year. Consumer durables, in particular, saw their worst performance in 26 months.
At the moment, producers may be holding back on price hikes, looking at how weak demand is. If so, in case demand picks up again — perhaps fueled by RBI’s recent policy rate cut — inflation could edge up once more.
The bottom line
While low inflation always looks like good news, in our view, January’s inflation figures offer a mixed picture. An easing in prices, of course, will be a welcome respite — particularly for households grappling with everyday expenses. At the same time, if our hypothesis is right — and this inflation comes partly from weaker consumption and waning industrial momentum, there’s some reason for worry as well.
The RBI made a good call this month despite this confusing mess. But its job is far from over, and many risks remain on the horizon.
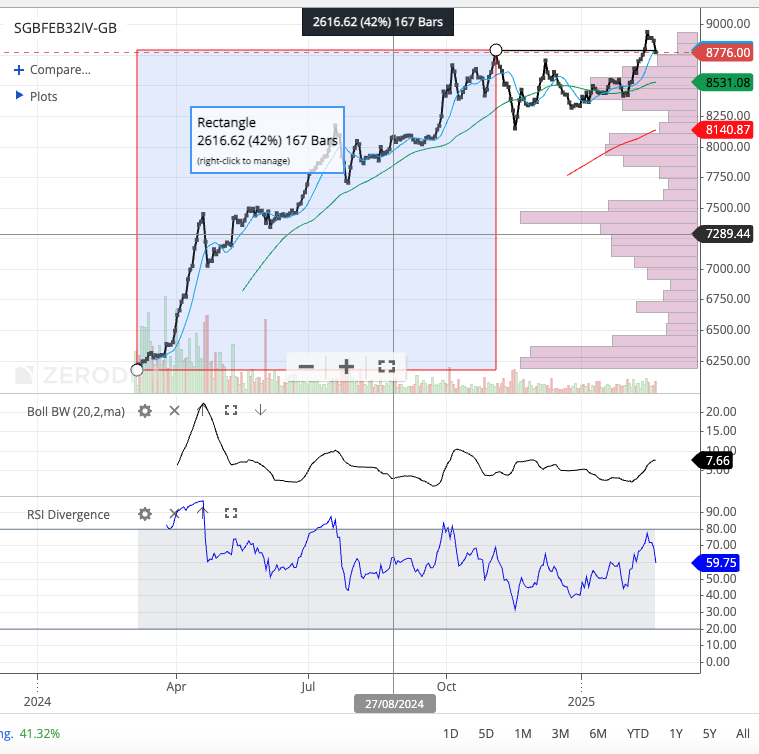
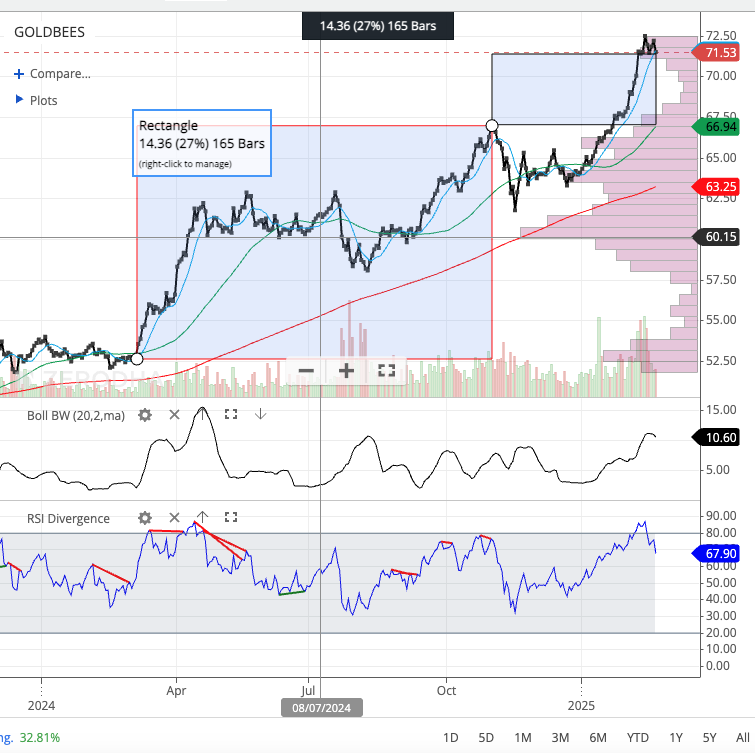
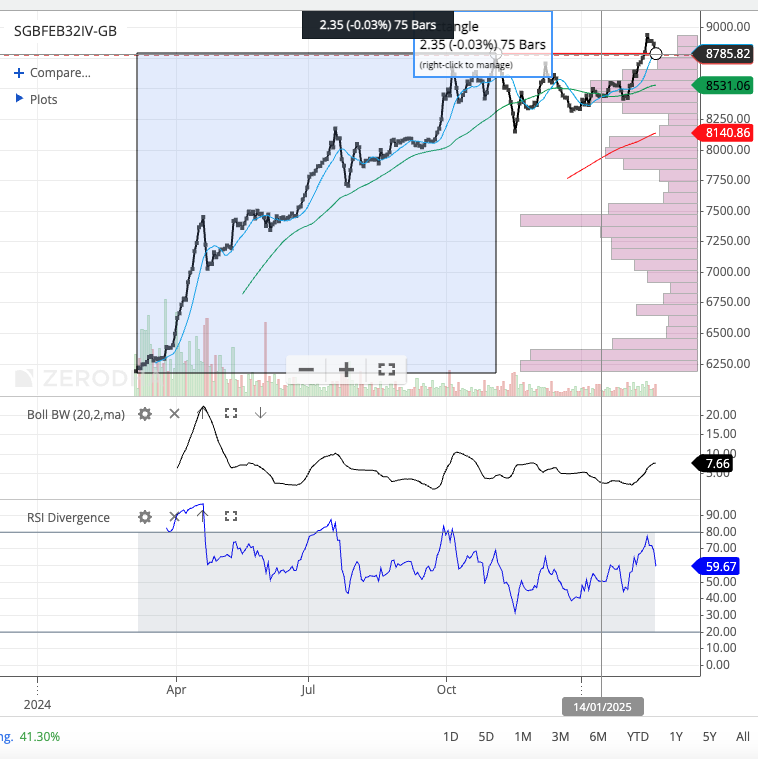
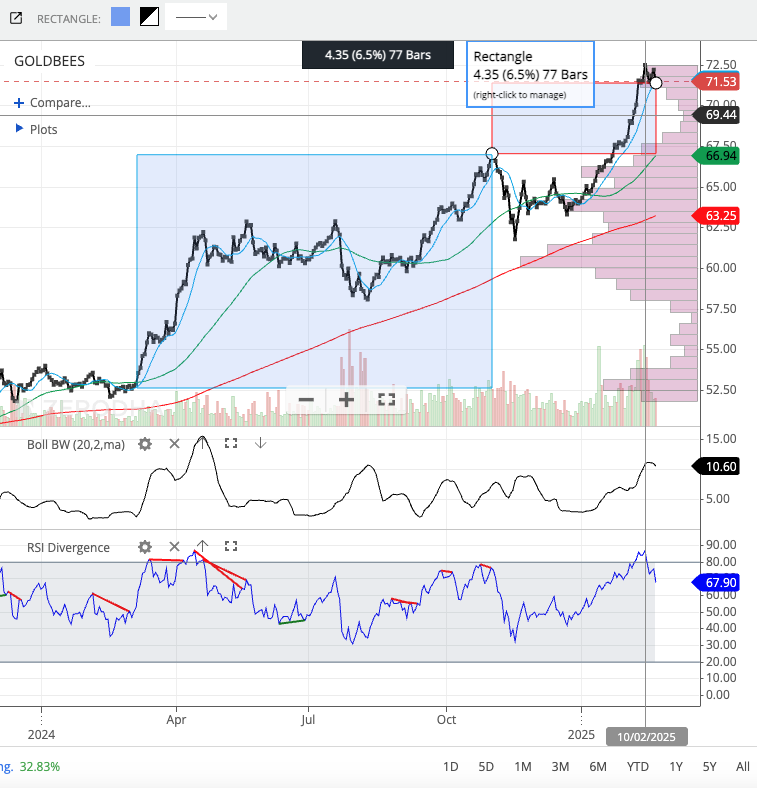
Gold prices hit the roof
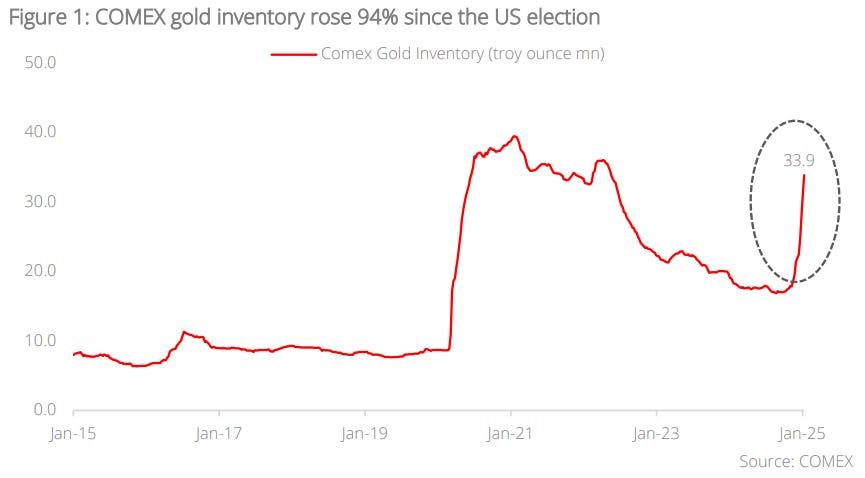
While Indian stock prices have been down for most of last week, there’s one thing that’s been on a relentless rise — gold . Last week, gold hit its highest-ever price in the international market, at $2,930 an ounce. In fact, from the beginning of this year (which, let us remind you, was barely 45 days ago), gold is already up more than 11%.
So, what’s happening? What’s driving this incredible demand for the metal? Let’s dig in.
The Broader Context of Gold Prices
Gold is an odd asset class with many competing uses, making it a nightmare to understand as an investor. On the one hand, it’s a commodity — used primarily for making jewellery, but also for various industrial purposes. At the same time, it’s also a store of value, which many people buy as insurance during times of uncertainty.
Over the last two years, gold has emerged as one of the world’s best-performing asset classes.
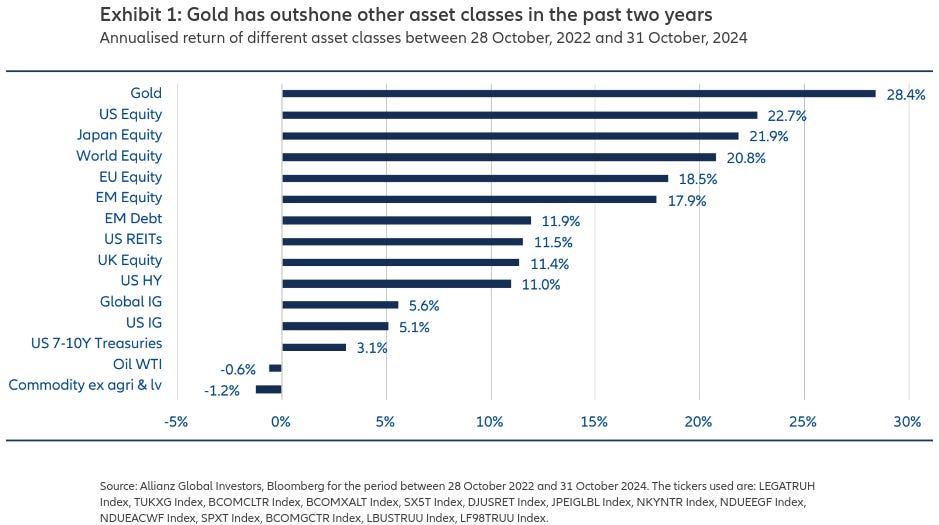
Source: Allianz GI
The rise in gold prices has hastened off late. Over the last month and a half, prices have surged in major economies from across the world.
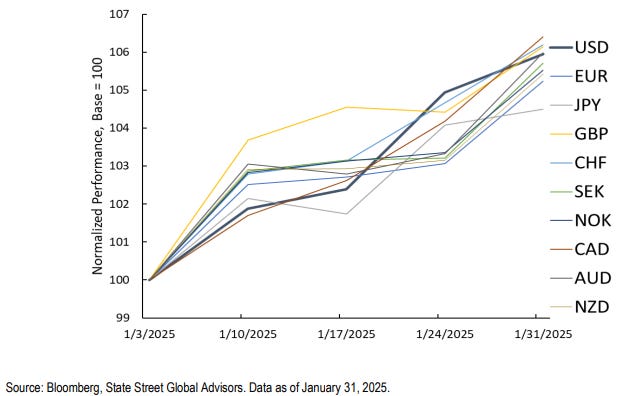
Source: State Street
Of course, this isn’t merely a matter of the last few months or years. As DSP Mutual Fund recently noted, it’s incredibly hard to find a portfolio that outperforms gold, at least in the long run. India, in fact, is among a minuscule group of markets that have done better than gold this century.
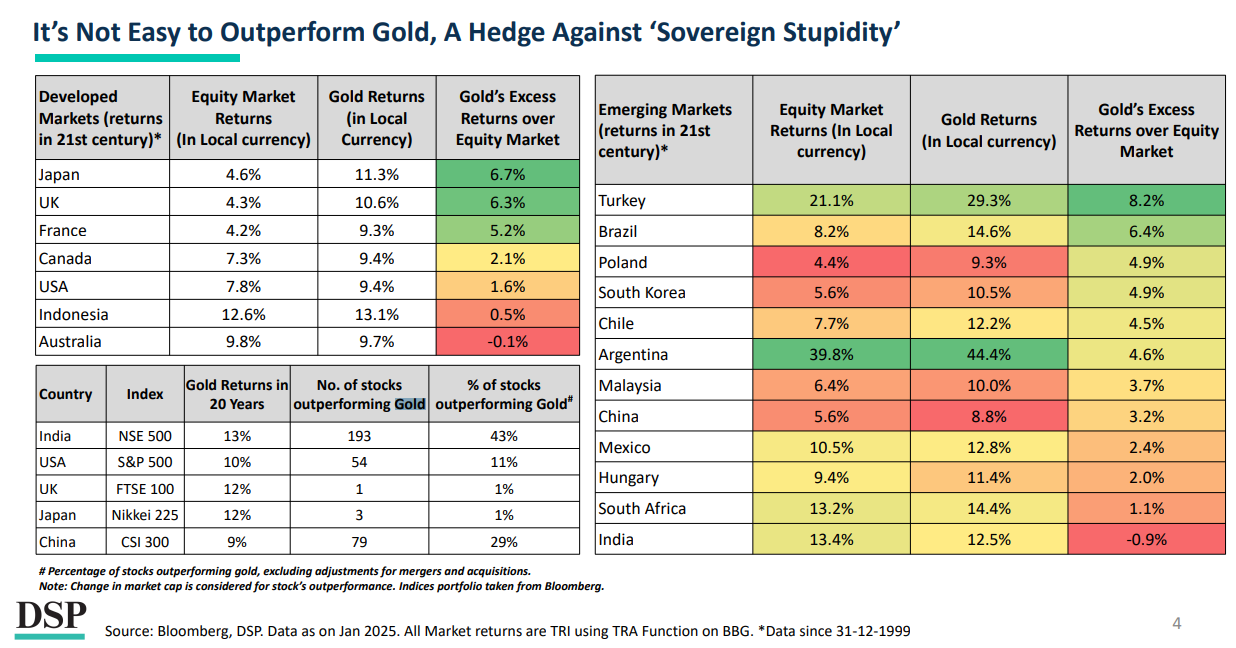
Source: DSP Netra
But even so, the surge in gold prices over the recent past has been truly remarkable.
Why are gold prices so high?
The reasons for this are complicated and multifaceted. They span a mix of supply-demand dynamics, investor behavior, and macroeconomic uncertainty. We’re not sure if there’s anyone in the world who completely understands how gold prices behave. They’re a little like early Bitcoin—prices rise and fall based on the whims of others; looking for deeper reasons is like chasing fiction.
Even so, we’ll try and break things down as simply as possible:
1. Jewellery demand
A big factor behind the demand for gold is its use as jewellery — driven largely by consumers in India and China, two of the largest buyers of the metal.
Overall, 2024 saw a drop in gold demand. Compared to 2023, the demand for gold jewellery across the world was down by 11%. A big reason for this was China. With the Chinese economy running under par for much of the year, the demand for gold jewellery in the country fell 24% year-on-year in 2024. Retailers had to turn to lightweight designs and alloys to woo new buyers. In fact, China’s jewellery demand last year was 26% below its 10-year average, marking one of the worst years for Chinese gold consumption. Towards the end of the year, however, demand picked back up. In the final quarter of 2024, gold demand doubled, quarter-on-quarter.
Back home in India, however, demand remained strong. Despite the rise in gold prices, volumes were only down 2% — showing tremendous resilience. A big reason for this is government policy. In July last year, the Indian government slashed gold import duties from 15% to 6%. This significant reduction in costs fueled a massive increase in demand, which, in turn, drove up prices worldwide. In all, India demanded 563.4 tonnes of gold last year — making us the largest gold jewellery market in the world.
2. Deep policy uncertainty and global risk
One of the primary reasons gold always remains relevant is that it’s perceived as a hedge against ‘sovereign stupidity.’ Whenever governments make policy decisions that create uncertainty or weaken economic fundamentals, investors flock to gold.
For decades, the U.S. dollar has been considered the world’s safest currency — which is why investors have always reached for it. However, concerns about America’s rising fiscal deficit and mounting debt have eroded some of that trust. Historically, there has been a strong correlation between U.S. debt levels and gold prices. The post-COVID fiscal expansion in the U.S. raised concerns about long-term sustainability. Now, with Trump back in office, fears of tax cuts and widening deficits are further fueling gold’s rally.
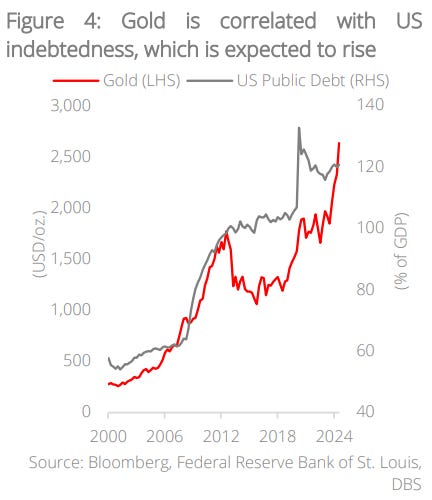
Source: DBS
On top of this, with the election of Trump, global markets are currently experiencing a period of extreme uncertainty. This policy uncertainty — including a threat of gold tariffs — has further boosted gold demand. Gold, therefore, is emerging as the preferred safe-haven asset.
Source: DBS
3. Equity market sell-offs and currency weakness
The emergence of DeepSeek into public consciousness sparked a significant sell-off in U.S. equities. In addition, European and Chinese markets have also been sluggish over the past year due to economic slowdowns. In times like this, when people are bearish about traditional asset classes, they prefer safe assets where they can park their capital until market volatility subsides. Gold is one such safe asset class.
Gold prices also rise when investors seek to hedge against weakening currencies. The U.S. Federal Reserve recently paused rate cuts, signaling concerns over persistent inflation. Similarly, in Japan, inflation has resurfaced after decades of deflation. Higher-than-expected inflation and the expectation of elevated interest rates have led investors to seek alternatives to fiat currencies—gold being one of the most trusted options.
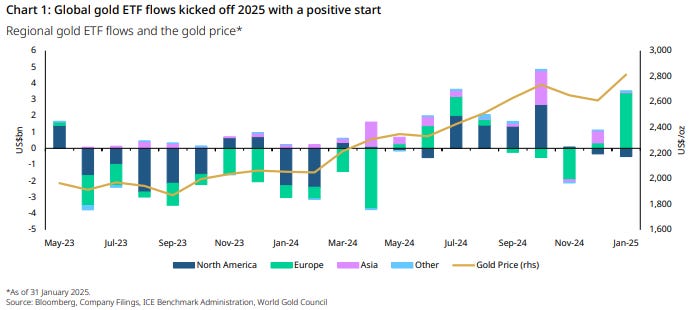
People’s shifting preferences show up in ETF flows. Between November 2020 and May 2024, despite an increase in gold prices, people appeared to be taking money out of Gold ETFs. Throughout this entire period, ETFs were selling off between 180-200 tonnes of gold every year.
Over the last three quarters or so, however, this trend has reversed. Suddenly, inflows rose — with ETFs adding 63 tonnes of gold between June and December last year — the longest period of sustained buying since 2020. While there were some outflows following the US elections, inflows have recovered yet again — with January seeing a strong rebound.
Source: Gold.org
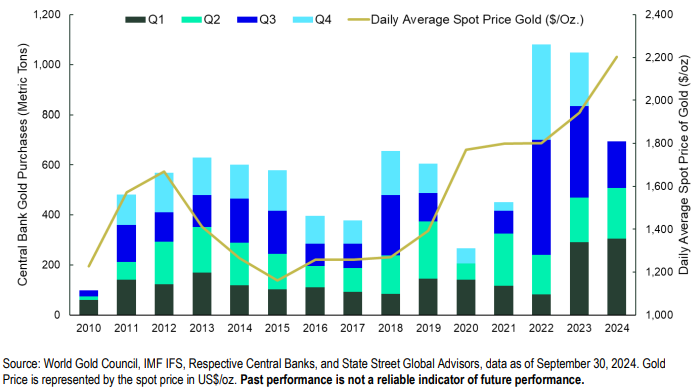
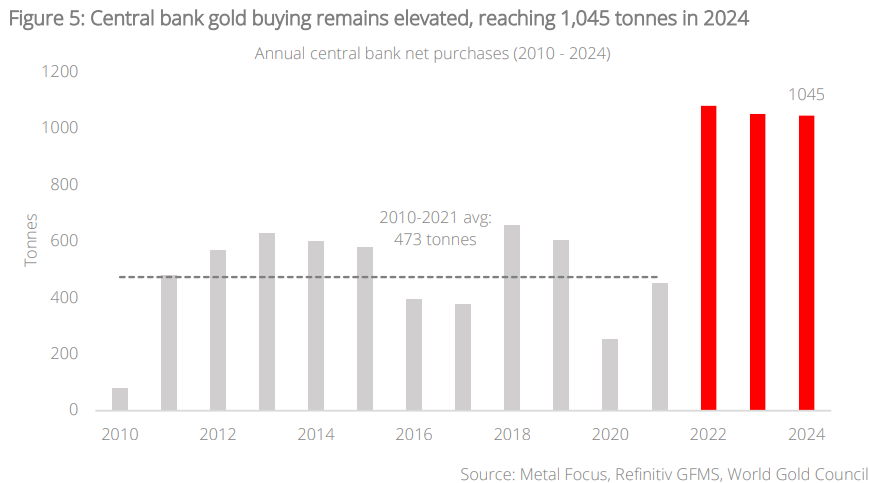
4. Central banks are stockpiling gold
As the world becomes more fragmented, central banks are starting to see gold as a good alternative to the Dollar for their reserves.
Source: State Street
Central banks have been accumulating gold for the last 15 years. However, they picked up their pace in the last few years — following Russia’s invasion of Ukraine and the conflict in the Middle East. Over the last three years, the world’s central banks have bought over 1,000 tons of gold a year. For context, between 2010 and 2021, they bought less than half of that — ~473 tonnes a year.
In fact, the Reserve Bank of India has become a key player in this trend. It purchased 73 tonnes of gold in 2024 — more than four times its purchases in 2023.
Source: DBS
The bottom line
Gold is a ‘bearer asset’—if you have gold in physical form, you face very little risk. You don’t depend on financial institutions or foreign countries for your assets to hold value. This is why gold prices are closely correlated with global uncertainty. As the world grapples with everything from inflationary pressures to geopolitical tensions, everyone—from retail investors to central banks—is increasingly drawn to purchasing gold as a strategic asset. So, if you’re wondering why gold prices are going up, one answer is: it’s a symptom of a decline in people’s trust—in the markets, in their economies, and in each other.
Tidbits
- India’s auto exports surged 40.2% YoY in January 2025, with two-wheeler exports rising 46.2% to 380,528 units, passenger vehicles (PVs) up 17% to 57,585 units, and three-wheelers growing 20% to 23,859 units, according to SIAM. In contrast, domestic dispatches remained sluggish, with PV sales inching up 1.6% to 399,386 units, two-wheelers up 2.1% to nearly 15 lakhs units, and three-wheelers increasing 7.7% to 58,167 units. The export momentum signals India’s rising role in global auto markets, but domestic sales growth remains muted.
- Adani Green Energy has exited its 350 MW wind power projects in Sri Lanka, valued at $442 million, due to tariff renegotiations by the new government. The 250 MW Mannar and 100 MW Pooneryn projects were expected to be commissioned by 2025 but faced political scrutiny for being awarded without competitive bidding. The move delays Sri Lanka’s renewable energy expansion, as the projects were key to its transition strategy.
- India’s finished steel imports surged 20.3% YoY to 8.3 million tons in April-January, making the country a net importer, largely due to rising shipments from China. Meanwhile, exports plunged 29% YoY to a seven-year low of 4 million tons, even as domestic consumption hit 124.8 million tons—the highest in at least seven years. Crude steel production rose 4.5% YoY to 124.9 million tons, but cheap imports pushed hot-rolled coil prices down 15% between September and December. Steelmakers are under pressure, prompting the government to consider a 15%-25% safeguard duty within six months to a year to curb inflows.
- This edition of the newsletter was written by Pranav
 Have you checked out One Thing We Learned?
It’s a new side-project by our writing team, and even if we say so ourselves, it’s fascinating in a weird but wonderful way. Every day, we chase a random fascination of ours and write about it. That’s all. It’s chaotic, it’s unpolished - but it’s honest.
So far, we’ve written about everything from India’s state capacity to bathroom singing to protein, to Russian Gulags, to whether AI will kill us all. Check it out if you’re looking for a fascinating new rabbit hole to go down!
Subscribe to Aftermarket Report, a newsletter where we do a quick daily wrap-up of what happened in the markets—both in India and globally.
Thank you for reading. Do share this with your friends and make them as smart as you are ![]() Join the discussion on today’s edition here.
Join the discussion on today’s edition here.