I am trying to put in a algo where i want to sell when EMA(10) crosses below EMA(1875) in the 1 day candle.
Now if I just use the graph lets say for APARINDS script and plot it on Zerodha, it clearly shows that the crossover happened a few times in 2017. But when I backtest the same in Streak for that period, it gives no trades. Why is that so can you please share the reason behind that?
When you backtest in streak with 1 day candle, it checks / executes order only at 9.15 am and 3.20 pm. Obviously, this is a major drawback. Your ema crossover must be happening in the mid of day, that’s why it is missing those.
If you select day candles, the algo requires the complete day candle to be formed to calculate the signals. As per methodology it generates signal at the open of the next candle ( in this case on the next day at 9.15 am ) because the candle interval selected is 1 day candle .
A chart is formed from various price points plotted on a graph. When a chart is open, these price points are derived from the live server, i.e from the market watch ticks. Whatever ticks are coming on the marketwatch those prices are considered for formation of the chart.
But when you open a chart midway the chart gets plotted from the data points that is already stored on the data server. Since there’s a difference between the broadcast of the live ticks and the number of stored ticks per second, there may be a slight difference in the way the chart appears.
For eg: The number of price points used to plot the graph while viewing it live maybe 4-5 but when you open a new chart, it may form from price points from the data server which may have recorded only 1 tick.
Do write to support[@]streak.tech with your algo details and we will help you out
Let us say I go for a stochastics crossover on 1 hr charts, does it mean I have to wait till the end of signal for confirmation and to enter the trade.
Also can you please comment on the reliability and validity of the signals generated?
When you set the candle interval as 1 Hr, the system will check you set conditions after the completion of the hour candle, ie after every 1 hr.
If the candle has not closed, there is a possibility of the price moving in the opposite direction. When the candle closes, the information on the basis of which the signals are provided is defined.
Thanks Krishnendu. I was looking at something like this for my short term delivery trades. It is very difficult to be glued to the screen, so this helps.
Dear @Krishnendu, I just took subscription of the streak platform.
I have created a couple of strategies and backtested them. Now I would like to deploy them but unable to do so. Could you please guide me as to how I can deploy them?
Please also note that the mobile app is not working properly for me. It is not allowing me to create or run any back tests. So I do not know how any notifications also would be enabled.
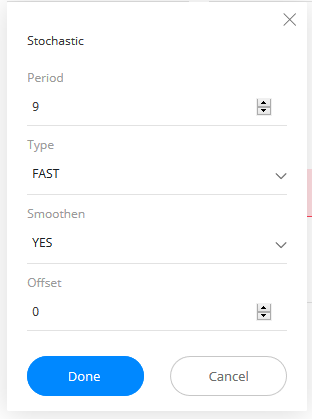
Also MOST IMPORTANTLY, the stochastic indicator on the mobile app does not show offsets while the web version shows. Please clarify this omission.
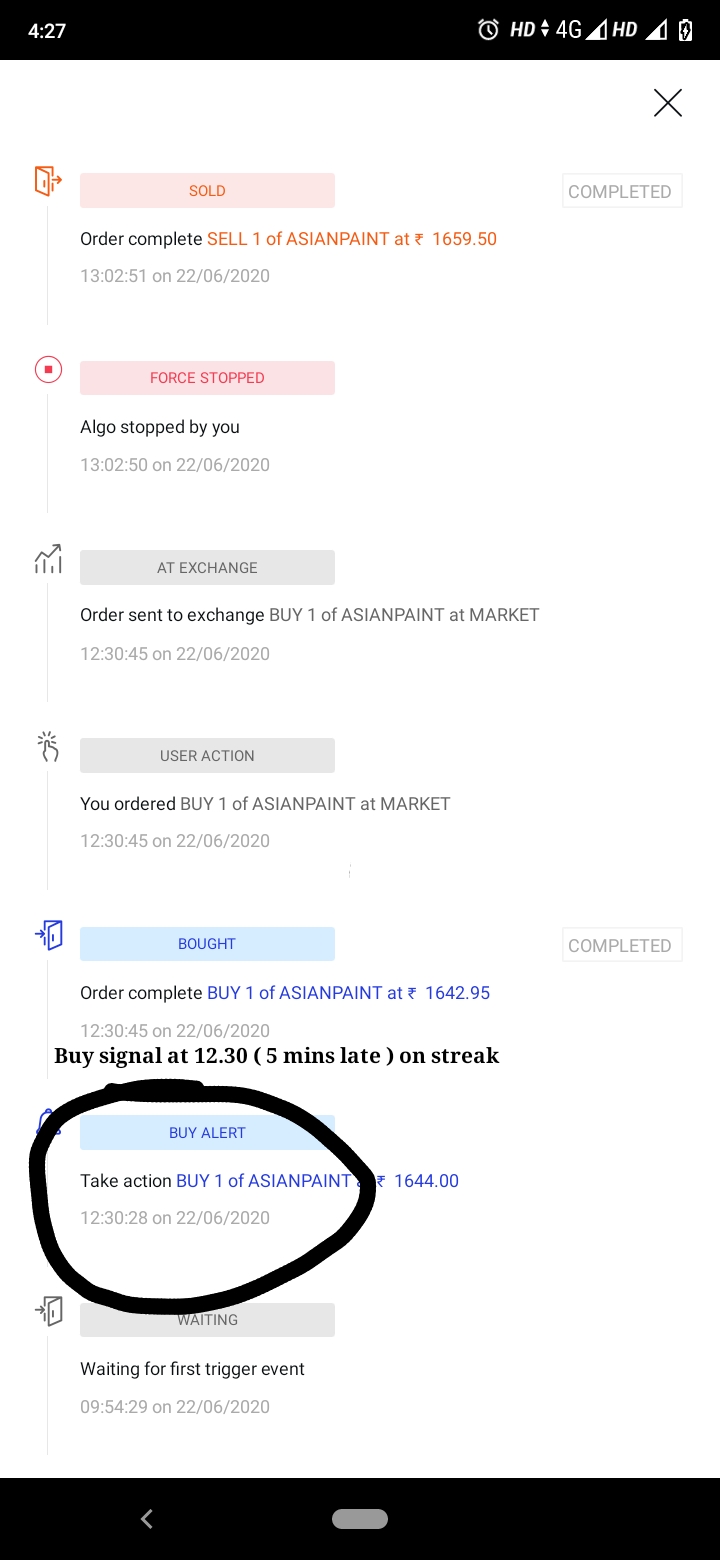
I am using 5 min candle to check… However streak signals are triggered after 5 mins post condition is satisfied. See the Attachments. Streak is so late, converting profit into loss