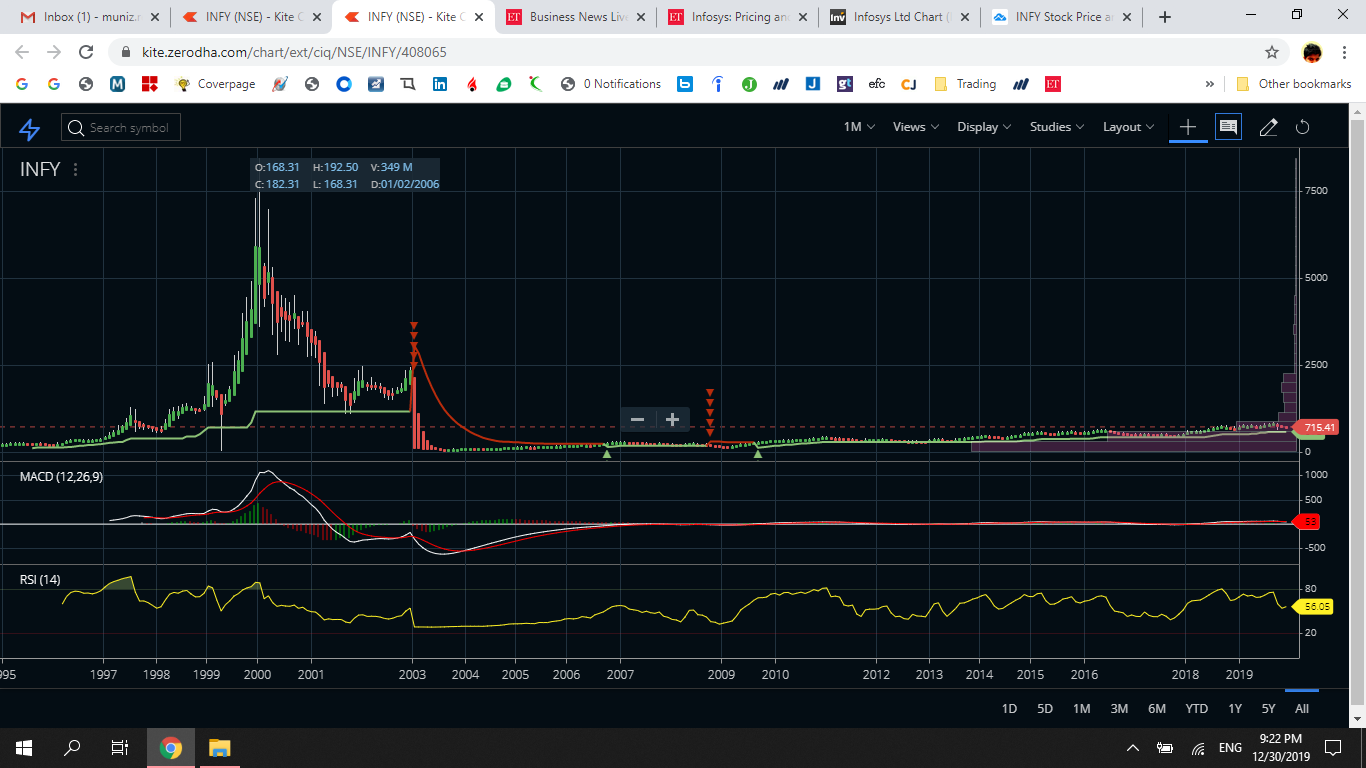
its Infy Chart, Why its showing so, is it correct?
Its exactly same as if u want to see complete Mount everest inside a 12x12 room. Lol.
U want to see 20 yrs data in a single window without expanding time factor. Zoom the chart for enhanced view.
2 Likes
@Muniz.Reza
Only thing I can think of is, you might have confused between 1M (1 Month) candle charts and 1m (1 minute) candle charts. Try changing it to 1 minute and see if you still feel something is wrong.
If not that, then there is nothing wrong with the chart.
1 Like
In the year 2000, the price reached above 5000… none of the other charts (screener,tradingview,yahoo) doesnt show such a price level… why so
Okay, I think i recollect now, someone from Zerodha had mentioned, that’s because Corporate actions are not considered or adjusted before 2003/2004 in Zerodha. I don’t think they are working on this for now too.
So, if you consider the corporate actions, it might be fine not sure.
It was the case for a lot of other stocks too like HDFC and Wipro.
1 Like