I am attaching a screenshot here . Here as per my analysis the stock is showing bearish divergence in Rsi. As per it I took downside trade. But the stock went upside.
Is my analysis correct . Please explain it.
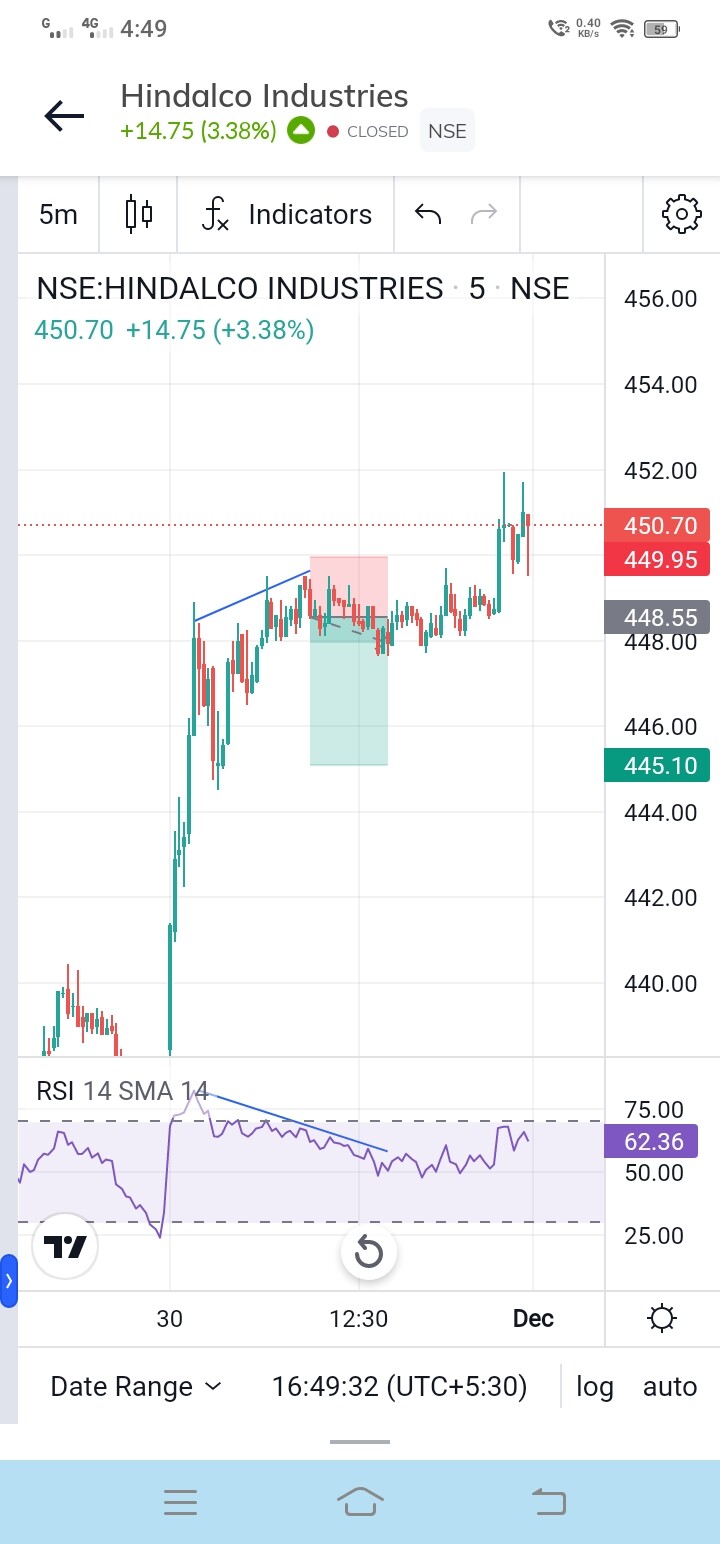
Is that a 5 minute chart? Does RSI work for such lower time frames?
I do not use RSI for trading so I cannot comment on it.
The price action for the day seen has been strong with the stock opening and running up 2.5%
The short position was a contra trade when the price was in an uptrend.
All bearish divergences do not have to work in your favor.
If the trade goes wrong, you exit with SL. Getting out without much loss is still a decent trade.
Yes , I don’t know whether it will work or not
If you are on 5 minutes time frame, change it to higher time frames and see what RSI does, you may get a different picture.
This is a question to be asked to the market itself.
Take many many trades with your plan - backtest/live. Do you make money ? If not it does not work. Beyond that different people will have different way of looking at things and there is no one answer for everything. We can have edges in both momentum and mean reversion, and one may be more dominant than other in a given market/timeframe.
A lot of things don’t really work, so we have to do the work to figure out what does.
And any answer is only in probabilities. So maybe your setup has great edge. Even then you can have a failed trade - you will have many failed trades, that’s how it works. For ex, I have a system that has about 35% win rate. So 2 of 3 trades lose money.
1 Like
Does this mean, the system is a loss making system, or that the 1 trade that is successful compensates for the 2 losing trades, and the overall return from the system is a win?
Expectancy = AvgReward/AvgRisk*WinRatio - LossRatio
Just making up numbers for example :
Lets say you make 2.5R on average in winning trades and lose 0.9R on average in losing trades.
And say you win 33% of the time.
Expectancy = 2.5/0.9*0.33 - 0.67 = 0.246 = Positive. Means there is edge in this sample. All numbers should be after cost. You can use this to also compare edge per trade of different systems or different versions of a system. When designing a system, we need to keep balance between this + returns + max dd etc
1 Like
Is this 0.246 the return % from the system of each trade?
And is this formula your own or something that is practiced everywhere?
yes…
Just google trading + expectancy. % depends on risk taken, but basically just look at it as what your average trade makes relative to risk.
Its not the only thing to look at as you can make more money with lower expectancy by taking more trades.
But anyway, R:R and winrate determines whether you have edge. R:R alone means nothing. Only brought it up to indicate to OP that losing on a trade is perfectly normal. No amount of analysis will prevent that and you can lose often and still have an edge.
Same system i can tweak to win 60% of the time by taking profit targets. And it makes thing worse because of high costs.
1 Like
What is the minimum R:R one should have irrespective of the number of trades he takes? Or R:R is arbitrary and subjective and depends on number of trades, win ratio etc?
As always, it takes time to absorb what you say.
I wonder if newbies can make heads or tails ![]()
It depends on the system, market, cost per trade etc. Intraday costs are high for me, so generally i have to keep profit potential open till EOD instead of cutting it off.
Market is efficient enough to auto adjust numbers. Wait for bigger win and your winrate reduces almost in proportion. But we can have a sweet spot area, where things work better. So basically you run backtests with different Entry/Exit rules and see how market responds to different types of exits and use what works reasonably ok without over optimizing too much.
1 Like
How efficient are back tests, not for an index as whole but for an individual stock. Whatever patterns or changes has happened in the past were due to some reasons, and participants in that stock reacted to those incidents in a particular way. Things may have changed in business, not necessarily, but if they do change, whatever patterns that have emerged in the past may not be useful in the changed scenario?
In the past X was the reason, so Y was the reaction, now X2 has happened, X2 may or may not have any connection with X, so to what certainty that we can think that Y will be the result again, or Y2 will happen which may resemble Y?
- Backtests can be too optimistic even after including costs and trying to estimate slippages, Live results are the real numbers.
- What you see in the end is just aggregate of all the trades. We can have a lot of variation month by month and even year by year in system stats. For ex, shorts with trend have been suffering since covid for few systems i know, so edge per trade, win rate etc goes lower.
- Try to keep rules as simple as possible at the start and that should have an edge. Once we have that, then we can add layers of rules to tweak things
- Law of large numbers works, take more trades and results will approach your edge.
- Coming to your question - you don’t know and yes things can change. Edges do tend to persist, but markets can and have shifted behavior. From what i have read US markets used to respond to momentum in distant past but now Mean reversion is dominant. So the basic behavior of the market itself can change, let alone your optimized system rules. But at the same time, you wont know immediately that something is wrong. Uncertainty is built into trading, best we can do is try to manage it and adapt and diversify.
1 Like
Excellent. Thank you.
Fooled by Randomness
Enlightened by SpacemanSpiff ![]()
Looks like it, experiencing it.
Know the difference of colors first, later paint Mona Lisa ![]()
Sharpen your sword first, later conquer the world ![]()

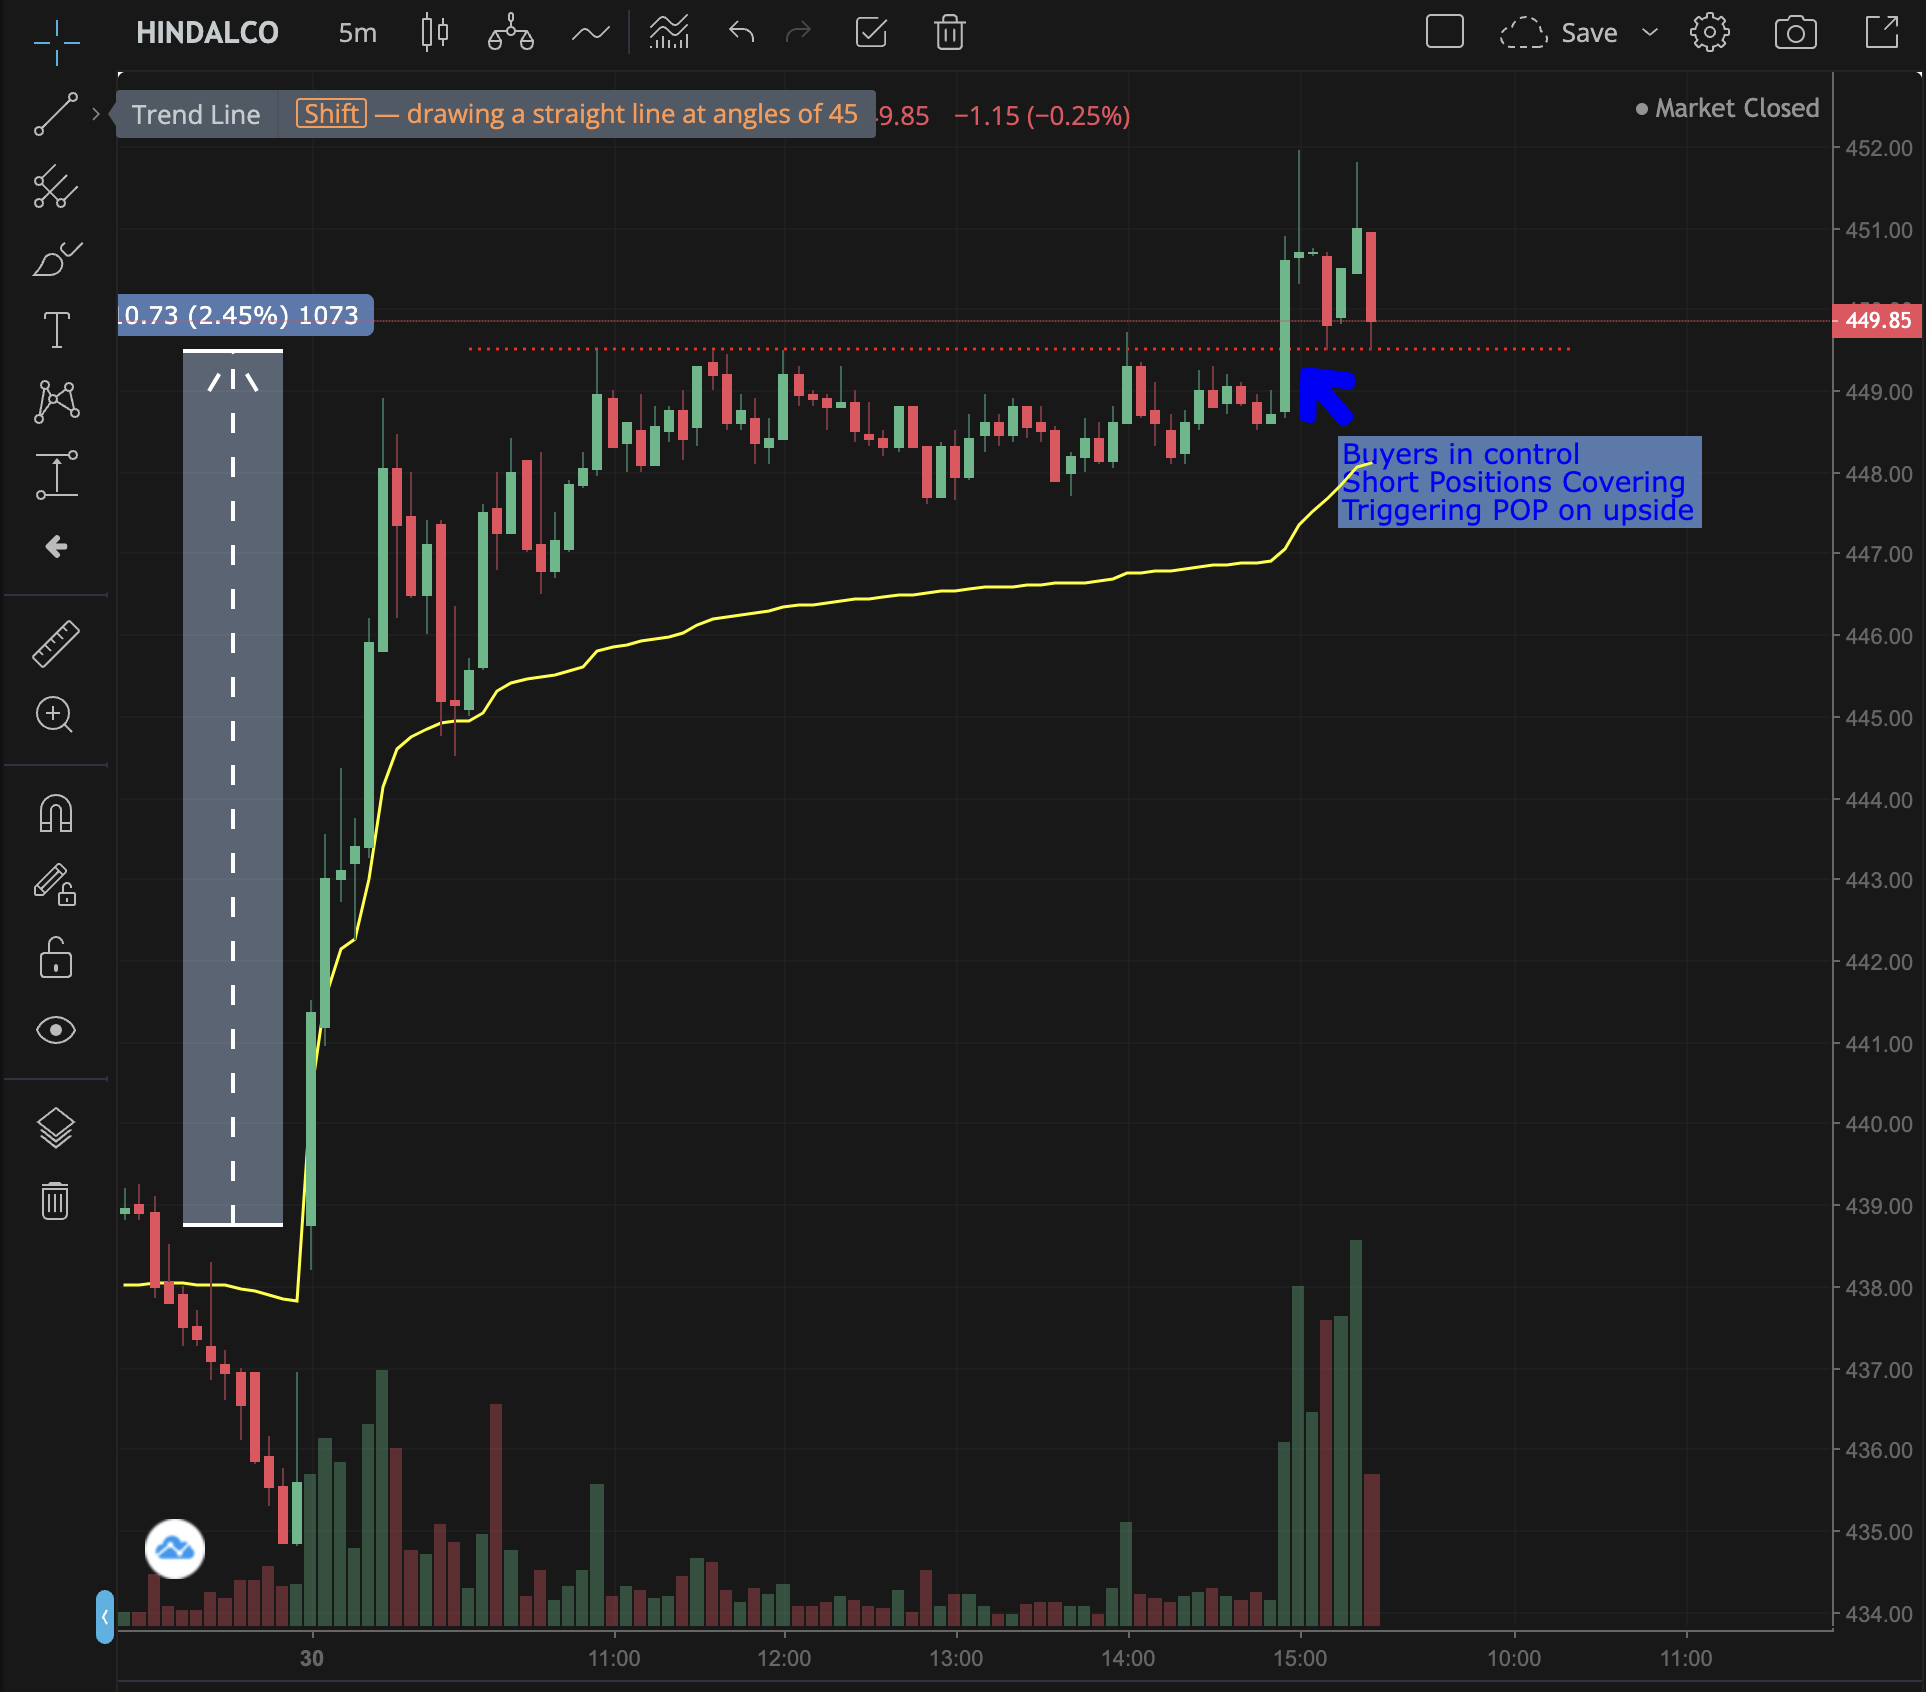
I only believe in trap trading RSI or RSI divergence strategy may work or is suitable for other but not for me
The LOGIC is purely simple stock was facing resistance everybody’s view was bearish then near resistance it created a zone and later the zone / support was breached and everybody entered their sell order put the stoploss on day high and their stoploss got HUNTED.
1 Like