Googling Intraday Stock Volatility Calculator returns a number of such tools.
I am attaching a screenshot of the output of result I want to achieve in an Excel Sheet. The example is of NG June Future - it does not matter what stock we choose.
Inputs Required:
A) Previous Session’s High Price, Low Price, and LTP
B) Today’s (first 15 min usually) Open, Low, High, and Current Prices
That is all and we get Buy Level with some Targets as well as Short Level and Targets. Also, a Min & Max Price movement range.
Googled a lot but could not figure out the formula they are using to produce these results.
Can anyone help do it in Excel?
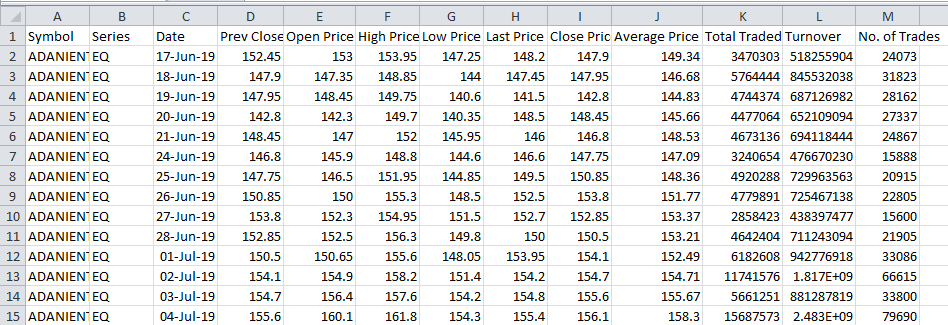
Not sure if this is what you need. Its available on NSE site, It doesn’t have OHLC for 15 minutes though.
Hi Vipul!
No, that is not related to the data available on NSE or BSE.
Let me put it in some other way.
If you want to do Intraday Trading in a particular scrip. You already have High, Low, Open, Close prices. What you want is what would be an ideal Buy Level or Sell Level and what possible targets we can set or stop loss we can maintain.
If you look at the screenshot I have shared in my current post, it has exactly that calculation.
At what price we should go long.
At what price we should go short.
Etc.
This is prepared based on some mathematical formulas which include mean and deviation etc.
Just trying to do it in Excel.
Ah, I misunderstood.
I have no idea what kind of formula must be used to have entry, stop, and target. I wonder if such a formula will work and what will be the win rate, risk: reward. I’m curious to know too.